XRP Price Builds Base—Short-Term Rally May Be Brewing


XRP price started a fresh recovery wave above the $2.120 zone. The price is now consolidating and might clear the $2.350 resistance zone.
- XRP price started a fresh recovery wave above the $2.120 resistance zone.
- The price is now trading above $2.20 and the 100-hourly Simple Moving Average.
- There is a connecting bullish trend line forming with support at $2.25 on the hourly chart of the XRP/USD pair (data source from Kraken).
- The pair might continue to move up if it clears the $2.350 resistance zone.
XRP Price Eyes Steady Increase
XRP price remained supported and started a recovery wave above the $2.00 zone, like Bitcoin and Ethereum . The price was able to clear the $2.050 and $2.120 resistance levels.
There was a move above the $2.250 resistance. However, the bears are now active near the $2.350 resistance zone. A high was formed at $2.348 and the price recently started a consolidation phase. There was a test of the 23.6% Fib retracement level of the upward move from the $1.90 swing low to the $2.348 high.
The price is now trading above $2.20 and the 100-hourly Simple Moving Average. There is also a connecting bullish trend line forming with support at $2.25 on the hourly chart of the XRP/USD pair.
On the upside, the price might face resistance near the $2.30 level. The first major resistance is near the $2.350 level. The next resistance is $2.450. A clear move above the $2.450 resistance might send the price toward the $2.50 resistance. Any more gains might send the price toward the $2.550 resistance or even $2.650 in the near term. The next major hurdle for the bulls might be $2.80.
Another Drop?
If XRP fails to clear the $2.350 resistance zone, it could start another decline. Initial support on the downside is near the $2.250 level and the trend line. The next major support is near the $2.120 level and the 50% Fib retracement level of the upward move from the $1.90 swing low to the $2.348 high.
If there is a downside break and a close below the $2.120 level, the price might continue to decline toward the $2.050 support. The next major support sits near the $2.00 zone.
Technical Indicators
Hourly MACD – The MACD for XRP/USD is now gaining pace in the bullish zone.
Hourly RSI (Relative Strength Index) – The RSI for XRP/USD is now above the 50 level.
Major Support Levels – $2.250 and $2.120.
Major Resistance Levels – $2.350 and $2.450.
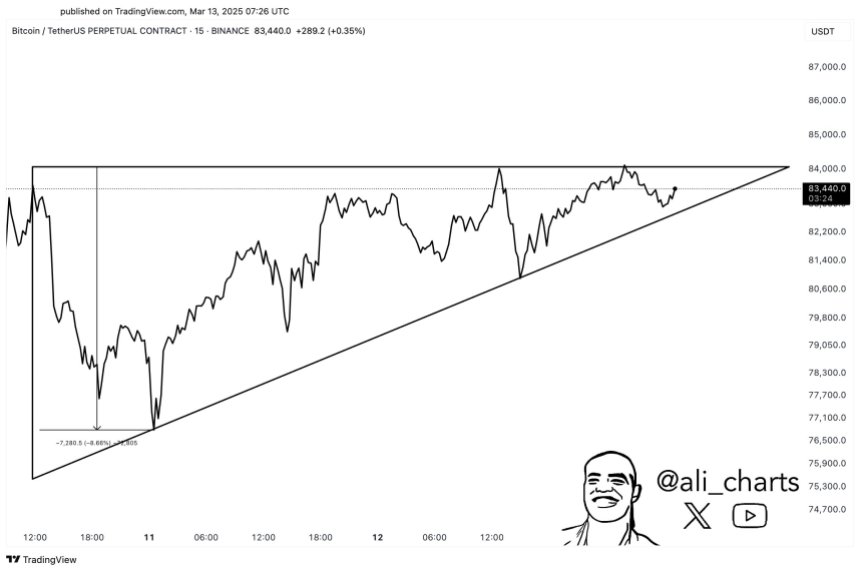
Bitcoin Faces Rejection At $84,000, But Analysts Show 2020 Similarities – Recovery Ahead?
Bitcoin (BTC) has failed to reclaim $84,000 resistance again and has fallen 4% to retest another cru...

Best AI Agent Coins to Buy as Investor Hype Remains Steady on AI Industry
Although it may seem like crypto dominated world markets for the better portion of the last half yea...
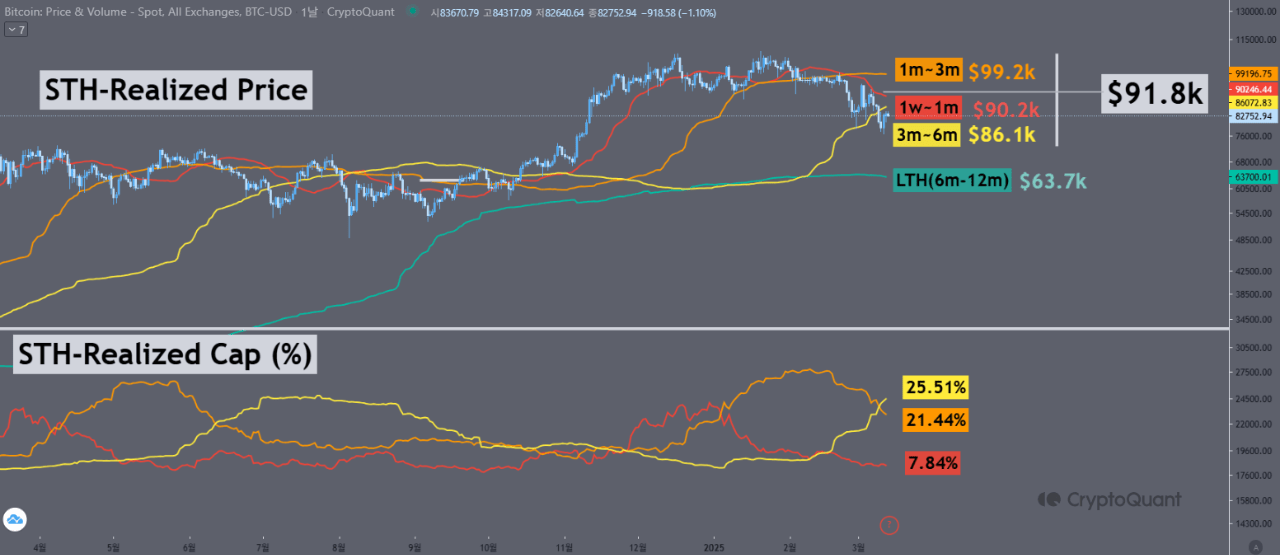
Bitcoin’s Price at a Crossroads—Will It Break $86K or Drop to $64K Support?
Bitcoin’s price appears to be still struggling below key levels. So far, the asset still trades belo...