Cardano (ADA) Next Move—Are Traders Eyeing a Big Push Higher?


Cardano price started a recovery wave above the $0.720 zone. ADA is correcting some gains and might find bids near the $0.7380 zone.
- ADA price started a recovery wave from the $0.690 zone.
- The price is trading above $0.720 and the 100-hourly simple moving average.
- There is a connecting bullish trend line forming with support at $0.7385 on the hourly chart of the ADA/USD pair (data source from Kraken).
- The pair could start another increase if it clears the $0.7550 resistance zone.
Cardano Price Holds Support
In the past few days, Cardano saw a recovery wave from the $0.690 zone, like Bitcoin and Ethereum . ADA was able to climb above the $0.720 and $0.7320 resistance levels.
It even cleared the $0.750 resistance zone. A high was formed at $0.7661 and the price is now consolidating gains. There was a minor move below the $0.750 level. The price dipped below the 23.6% Fib retracement level of the upward move from the $0.6918 swing low to the $0.7661 high.
Cardano price is now trading above $0.720 and the 100-hourly simple moving average. There is also a connecting bullish trend line forming with support at $0.7385 on the hourly chart of the ADA/USD pair.
On the upside, the price might face resistance near the $0.750 zone. The first resistance is near $0.7550. The next key resistance might be $0.7620.
If there is a close above the $0.7620 resistance, the price could start a strong rally. In the stated case, the price could rise toward the $0.80 region. Any more gains might call for a move toward $0.850 in the near term.
Another Drop in ADA?
If Cardano’s price fails to climb above the $0.7550 resistance level, it could start another decline. Immediate support on the downside is near the $0.7380 level and the trend line.
The next major support is near the $0.720 level or the 61.8% Fib retracement level of the upward move from the $0.6918 swing low to the $0.7661 high. A downside break below the $0.720 level could open the doors for a test of $0.690. The next major support is near the $0.6550 level where the bulls might emerge.
Technical Indicators
Hourly MACD – The MACD for ADA/USD is losing momentum in the bullish zone.
Hourly RSI (Relative Strength Index) – The RSI for ADA/USD is now below the 50 level.
Major Support Levels – $0.7380 and $0.7200.
Major Resistance Levels – $0.7550 and $0.7620.
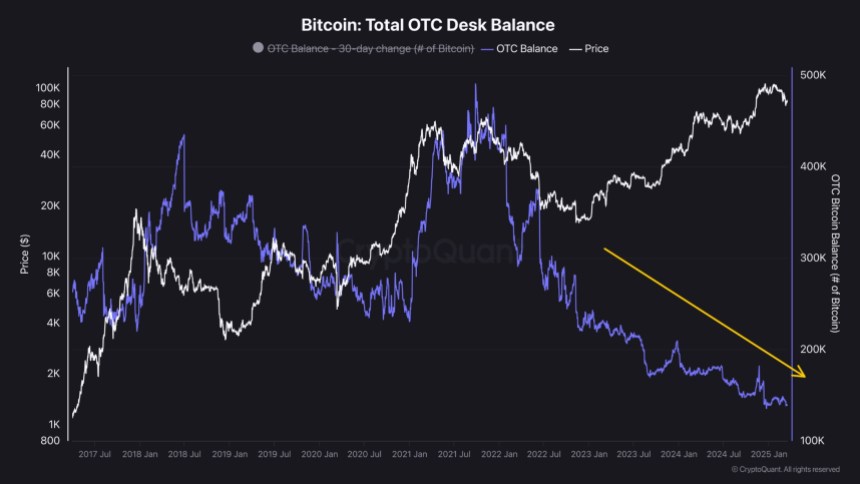
Bitcoin OTC Desks Are Draining – Supply Squeeze On The Horizon?
Bitcoin has dropped below the $85,000 level as selling pressure returns across the crypto market. Af...
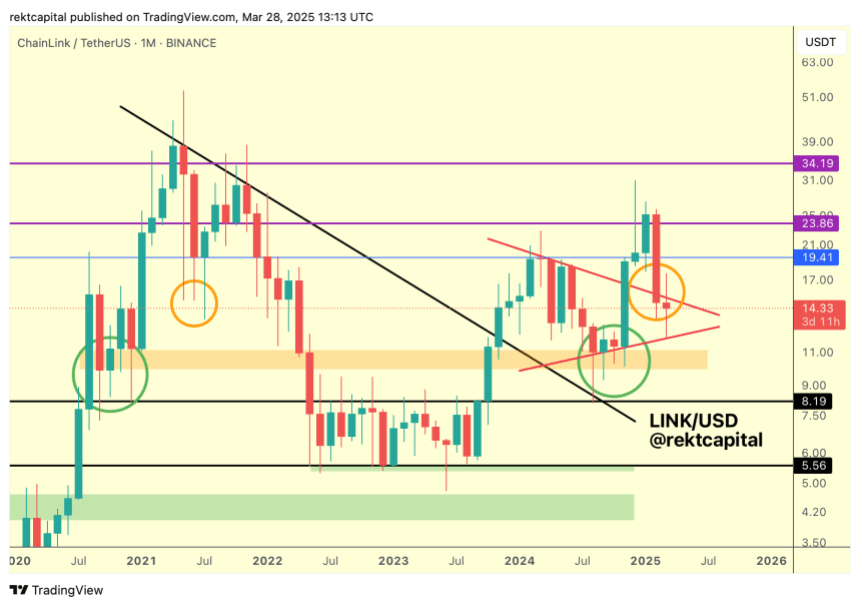
Chainlink Monthly Close To Determine LINK’s Fate – Here Are The Levels To Watch
Amid today’s market correction, Chainlink (LINK) has lost its recent gains, falling back to a crucia...
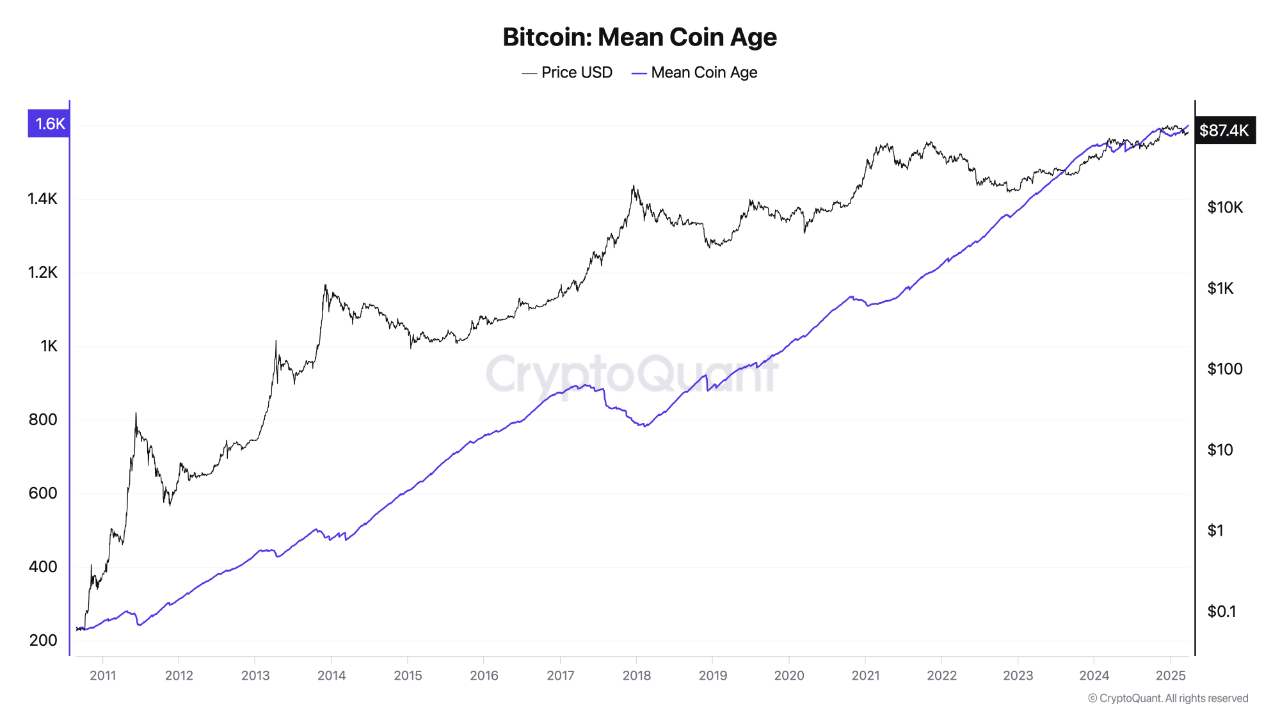
Bitcoin’s Rise Isn’t Random: Analyst Reveals What’s Really Fueling BTC Above $85K
Bitcoin (BTC) continues to trade above the $84,000 mark despite a slight decline in momentum this we...