Pi Network ($Pi) Price Prediction: Will Pi Coin Break Through $0.86 Resistance?


Pi Network’s (Pi) price has been consolidating around $0.82, struggling to break the $0.86 resistance level. Despite this price stagnation , the Pi community remains hopeful that the coin could experience a recovery, with some predicting a surge back to its all-time high (ATH) of $3.
However, recent market dynamics, including a price drop, have left traders and investors questioning Pi Coin’s path forward.
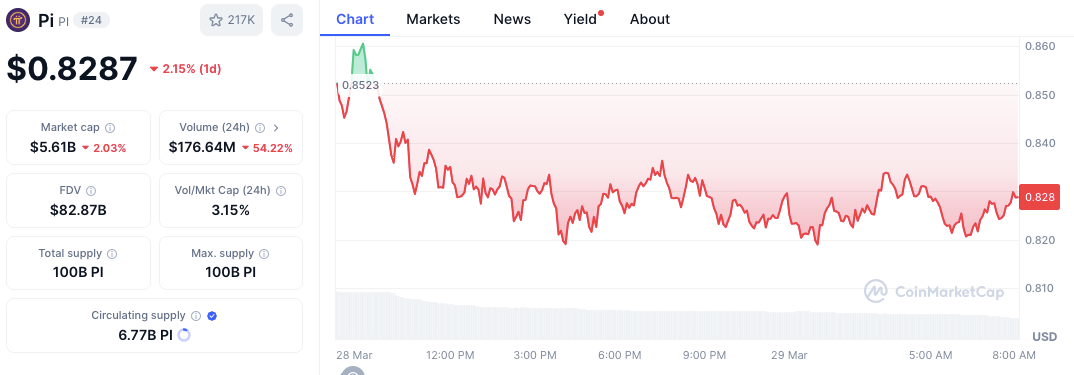
As of the time of writing, Pi Network ($PI) was trading at $0.8287, marking a 2.15% decrease over the last 24 hours. The coin’s market cap stands at $5.61 billion, with a 24-hour trading volume of $176.64 million, recording a decline of 54.22%. The price chart indicates large volatility, with Pi peaking at $0.8523 before falling back down, displaying a bearish trend.

One of the key factors influencing Pi Network’s price is its circulating supply. With 6.77 billion PI tokens in circulation out of 100 billion, a large portion of the token has yet to be distributed. This suggests possible future inflation or shifts in supply dynamics, which could impact Pi’s price as more tokens enter circulation.
Technical Analysis Shows Mixed Signals
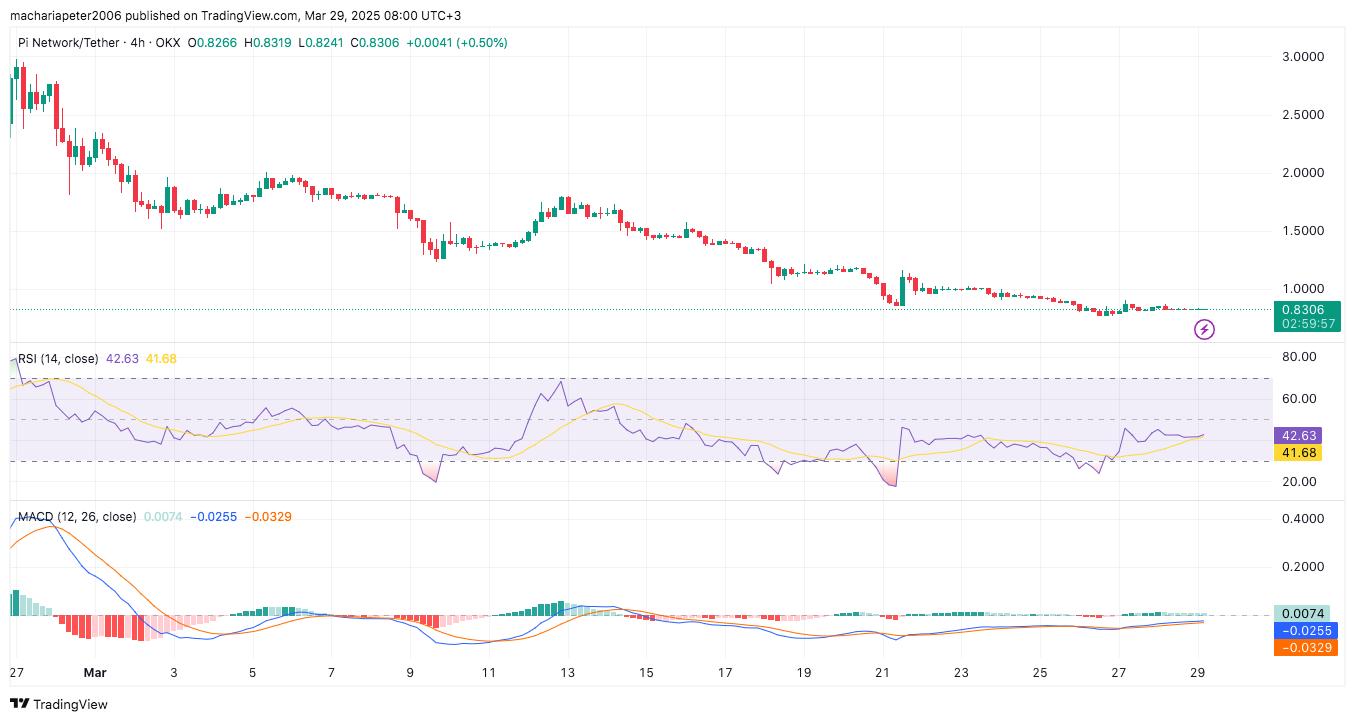
The Relative Strength Index (RSI) for Pi Network currently sits at 42.63, below the neutral 50 level. This implies that although the overall position of the coin in the market trends may be slightly bearish, the asset is not yet overbought. If the RSI goes higher than the 50 mark, then this might mean that the actual buying pressure is starting to rise, which is typical of a bullish market. Nevertheless, if the RSI dips below 30, then an oversold position is possible, thus the signal to buy.
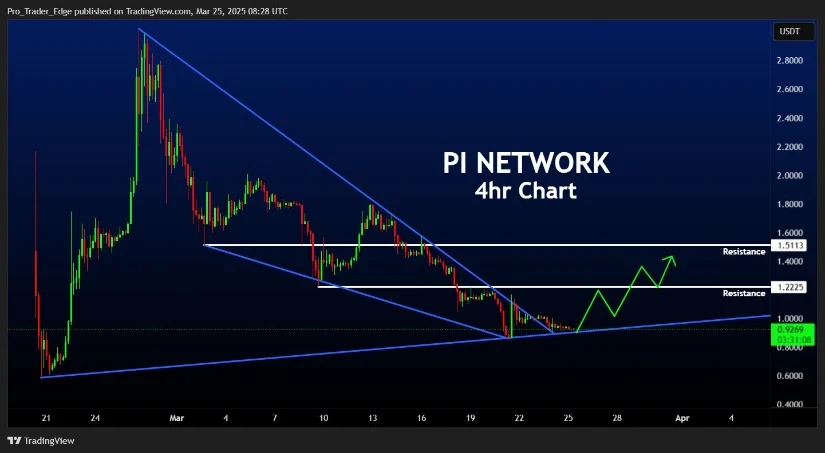
Analyzing the 4-hour chart of Pi in relation to the USDT pair, a descending triangle pattern is observed. This pattern points at the likelihood of Pi in a consolidation, where support is provided at $0.9269. The price faces resistance levels around $1.22, $1.40, and $1.51. If the price manages to move past these resistance levels, then there could be a continuation to the upside.

Indicators Show Diverging Sentiment
Currently, the Relative Strength Index (RSI) of the Pi Network is at 42.63, thus below the neutral 50 line. That means the market sentiment is slightly bearish, with the coin not being oversold. Breaking the RSI lines above 50 can signal a change towards bullish sentiment, meaning buying pressure is increasing. If the RSI bounces off 70, it would act as support, and a reversal would be possible. On the other hand, if the RSI drops below 30, it can be considered as an oversold condition, and it would be time for a reversal.
At the same time, the Moving Average Convergence Divergence (MACD) has a more conservative view. A negative divergence is produced when the MACD line and the signal line cross over with the MACD line at 0.0074 and the signal line at 0.0315.

Additionally, the histogram displaying the difference between the MACD and signal lines is shrinking, thus showing a slowing of downward momentum. If the crossover of the MACD above the signal line occurs, it could signal the possibility of an upward movement.

SHIB Price Prediction for March 31: Will Shrinking Bearish Momentum Lead to a Breakout?
Shiba Inu shows signs of recovery as $SHIB trades at $0.00001251, volume jumps 38.6%, and RSI, MACD ...

Solana Price Prediction for March 31: Can SOL Break Above $130 After 40% Annual Drop?
Solana ($SOL) trades at $124.34 after a 40% annual drop, with RSI and MACD showing weak recovery sig...

Ambient Unveils Revolutionary AI-Powered Proof-of-Work Blockchain with $7.2M Seed Funding
Ambient emerges from stealth mode with $7.2M seed funding from a16z CSX, pioneering a PoW AI blockch...

