Pepe Price Prediction For April 1: Can PEPE Break Above the $0.000008 Resistance?


- PEPE approaches key resistance, with breakout potential above $0.000008.
- Rising market activity signals bullish sentiment, with a 21.60% surge in trading volume.
- Technical indicators show bullish momentum, with RSI nearing 50 and MACD positive.
Pepe ($PEPE), the popular memecoin, is approaching a major point as it nears its descending trendline. The token’s market activity is rising, and bullish sentiment among traders is increasing.
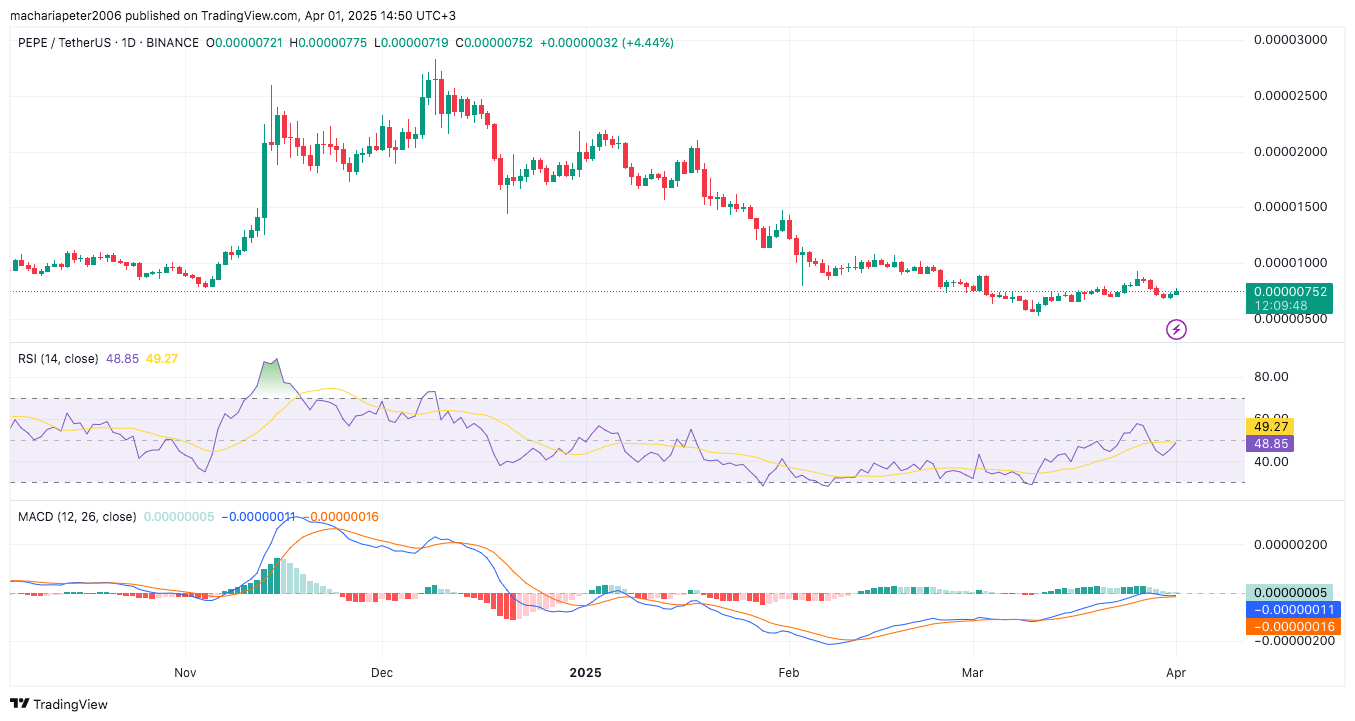
Pepe’s price has been under pressure after facing a rejection at its descending trendline on March 27, which connects several high points dating back to early December. This rejection led to an 18.43% drop in PEPE’s value by Sunday. However, the price has begun to recover, showing a nearly 4% rise on Monday.
The trendline, which coincides with the 50-day exponential moving average (EMA) around $0.000008, is a critical resistance zone. A profitable breakout above this point could signal a shift toward a bullish trajectory. As of press time, PEPE is once again testing this descending trendline, and a break above it could pave the way for further price increases.
Market Activity and Investor Sentiment
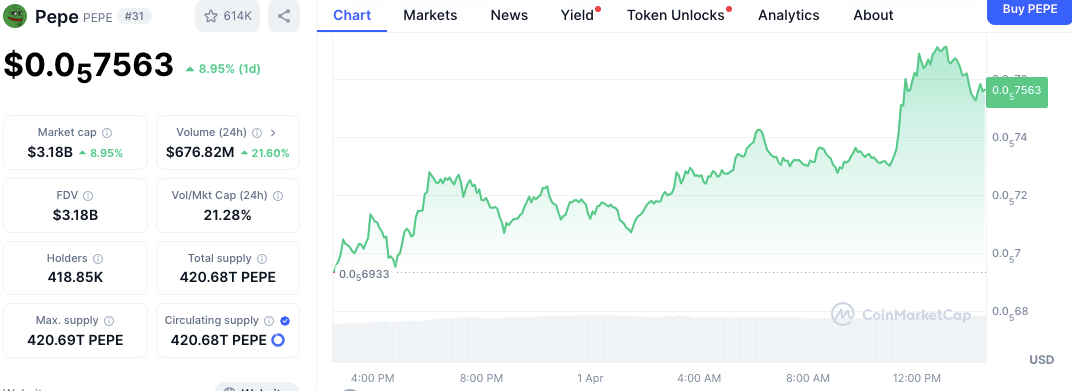
Pepe’s price is not the only indicator of growing momentum. However, in a 24-hour timeframe, the token has grown by 8.95%, and at one point, it could be purchased for $0.07563. This comes at a time when there was a rise in market activity by a 21.60% trading volume.
As of the latest data, PEPE’s market capitalization stands at $3.18 billion, supported by a 24-hour trading volume of $676.82 million. This surge in trading activity points to a positive shift in investor sentiment toward the token.

Pepe’s circulating supply has reached 420.68 billion tokens, nearing its maximum supply of 420.69 billion. Meanwhile, the number of unique holders has increased to 418.85K. The rising number of holders reflects growing interest and suggests that more investors are becoming involved with the memecoin, possibly driving further price movement.
Inflow and Outflow Data Reflect Price Movements
An analysis of Pepe’s inflow and outflow data from June 2023 to March 2024 shows a strong correlation between market participation and price fluctuations. Notable spikes in net inflows occurred in late June, early November, and mid-February, coinciding with price increases.

The largest price increase was noted in early November after the maximum net inflows were registered. On the other hand, outflows during periods in which the returns are low, such as in late November and December, also reflect the sensitivity of PEPE to market sentiment.
Technical Indicators Show Bullish Momentum
Technical indicators for PEPE suggest a cautiously optimistic outlook. The Relative Strength Index (RSI) is currently at 48.85, sitting near the neutral zone. While this indicates neither overbought nor oversold conditions, the RSI’s movement towards 49.27 could signal upward movement if it surpasses the 50 mark.

Likewise, the signal line of the Moving Average Convergence Divergence (MACD) gives a bullish signal. Currently, the MACD line is above the signal line, while the histogram bars of PEPE are green, which places the stock in bullish territory.
FAQs:
What is the current price trend for Pepe (PEPE)?
Pepe (PEPE) is testing a descending trendline and could break out above it if the price surpasses the $0.000008 resistance. Recent market activity shows rising bullish sentiment among traders.
How has Pepe’s market activity changed recently?
Pepe’s price surged by 8.95% in the past 24 hours, accompanied by a 21.60% increase in trading volume. This indicates a positive shift in investor sentiment.
What do the technical indicators suggest for Pepe’s future price movement?
Technical indicators like the RSI and MACD point to potential bullish momentum, with the RSI nearing 50 and the MACD showing positive divergence. These signals suggest the possibility of further price increases.

Crypto Market Faces $133B Liquidation Surge Amid Mixed Performance, PHOENIX Group Reports
The crypto market showed activity as Bitcoin ($BTC) maintained $84,164 while Ethereum ($ETH) surpass...

Meme Coins Are Taking a Backseat to AI Projects, and These 5 Have Big Potential for 2025
Meme coins are fading as AI crypto projects surge. Discover 5 AI tokens with strong utility and majo...

BlockDAG Presale Raised Over $210M Post Viral Keynote 3! More On HYPE & TAO Price in April 2025
As HYPE faces turbulence and TAO eyes $750, BlockDAG’s explosive presale growth and unmatched scalab...

