Cardano (ADA) Eyes Resistance Break—Failure Could Spark Fresh Losses


Cardano price started a recovery wave above the $0.5680 zone. ADA is consolidating near $0.60 and remains at risk of more losses.
- ADA price started a recovery wave from the $0.510 zone.
- The price is trading below $0.620 and the 100-hourly simple moving average.
- There is a connecting bearish trend line forming with resistance at $0.60 on the hourly chart of the ADA/USD pair (data source from Kraken).
- The pair could start another increase if it clears the $0.60 resistance zone.
Cardano Price Faces Resistance
In the past few days, Cardano saw a fresh decline below the $0.60 level, like Bitcoin and Ethereum . ADA declined below the $0.550 and $0.540 support levels.
A low was formed at $0.5106 and the price started a recovery wave. There was a move above the $0.540 and $0.5550 levels. The price cleared the 50% Fib retracement level of the recent decline from the $0.6712 swing high to the $0.5106 low.
Cardano price is now trading below $0.620 and the 100-hourly simple moving average. On the upside, the price might face resistance near the $0.60 zone. There is also a connecting bearish trend line forming with resistance at $0.60 on the hourly chart of the ADA/USD pair.
The first resistance is near $0.610 or the 61.8% Fib retracement level of the recent decline from the $0.6712 swing high to the $0.5106 low. The next key resistance might be $0.6320.
If there is a close above the $0.6320 resistance, the price could start a strong rally. In the stated case, the price could rise toward the $0.680 region. Any more gains might call for a move toward $0.70 in the near term.
Another Drop in ADA?
If Cardano’s price fails to climb above the $0.60 resistance level, it could start another decline. Immediate support on the downside is near the $0.5680 level.
The next major support is near the $0.5550 level. A downside break below the $0.5550 level could open the doors for a test of $0.5320. The next major support is near the $0.50 level where the bulls might emerge.
Technical Indicators
Hourly MACD – The MACD for ADA/USD is losing momentum in the bearish zone.
Hourly RSI (Relative Strength Index) – The RSI for ADA/USD is now above the 50 level.
Major Support Levels – $0.5680 and $0.5550.
Major Resistance Levels – $0.6000 and $0.6100.
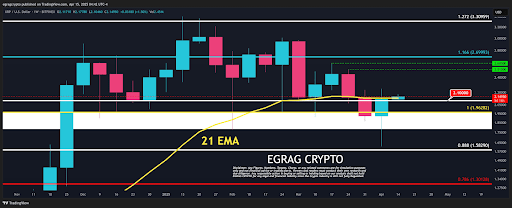
Here’s What Happens If The XRP Price Closes Out This Week Above $2.25
XRP is back trading above, $2, and bullish momentum is gradually creeping back compared to its price...
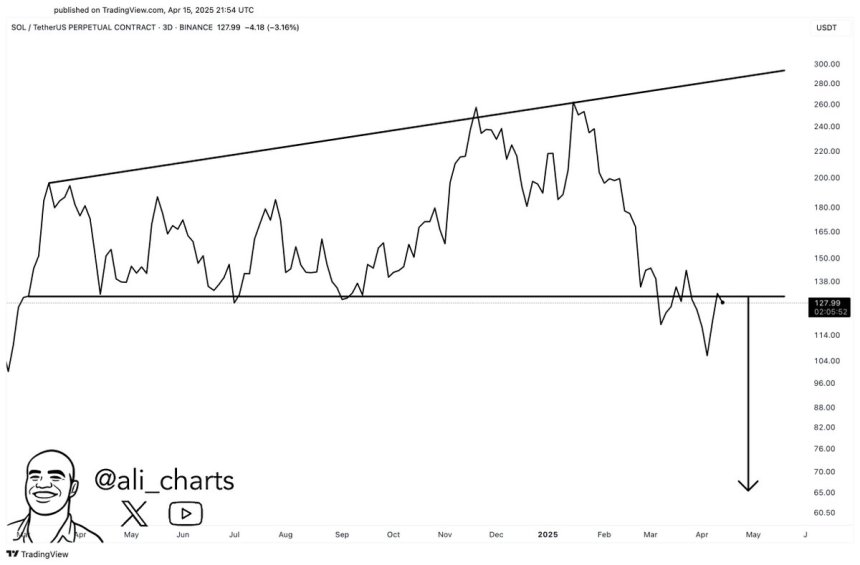
Solana Retests Bearish Breakout Zone – $65 Target Still In Play?
Solana is trading above the $125 level after bulls stepped in and reclaimed key levels, sparking opt...
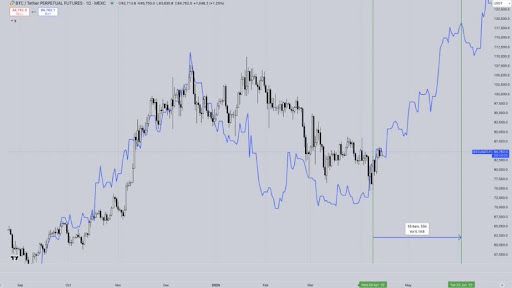
Bitcoin Price Following Analyst’s Prediction For Bullish Breakout, Here’s The Target
The Bitcoin price appears to be moving in lockstep with a bullish prediction made by a crypto analys...