Whales Dump $127M in Ethereum—Is This the Start of a Rally?


- A recently inactive Ethereum holder has transferred 30,000 ETH, of which 3,000 ETH went to Kraken, sparking fears of a selloff.
- Recently, Galaxy Digital transferred nearly 80 million ETH to exchanges, enhancing the pressure on the price of Ethereum.
- ETH is currently at $1,61,2, and if it breaks above $1,670, analysts are divided on whether ETH will continue to go up or down.
Ethereum market trends have changed as big players made significant operations across the exchanges. A Lookonchain report showed that an early ICO participant who had not been active for the past 3 years transferred 30k ETH, amounting to $47.85 million.
From this, 3,000 ETH was accumulated through deposits to Kraken, which showed signs of sell-side pressure in May. The same wallet held 76,000 ETH at the time of Ethereum’s genesis phase, which was bought for $23,560, illustrating the immense potential gains.
At the same time, Galaxy Digital reportedly sent 49,681 ETH worth approximately $80m to both Binance and Coinbase between the 12th and 17th of April. The transactions stemmed from the firm’s OTC wallet, which contains other digital currencies worth more than $11.8 million. Such exchange inflows indicate an increase in selling, and the current trend of increasing caution is well evidenced.
Network Activity Weakens While Price Attempts Recovery
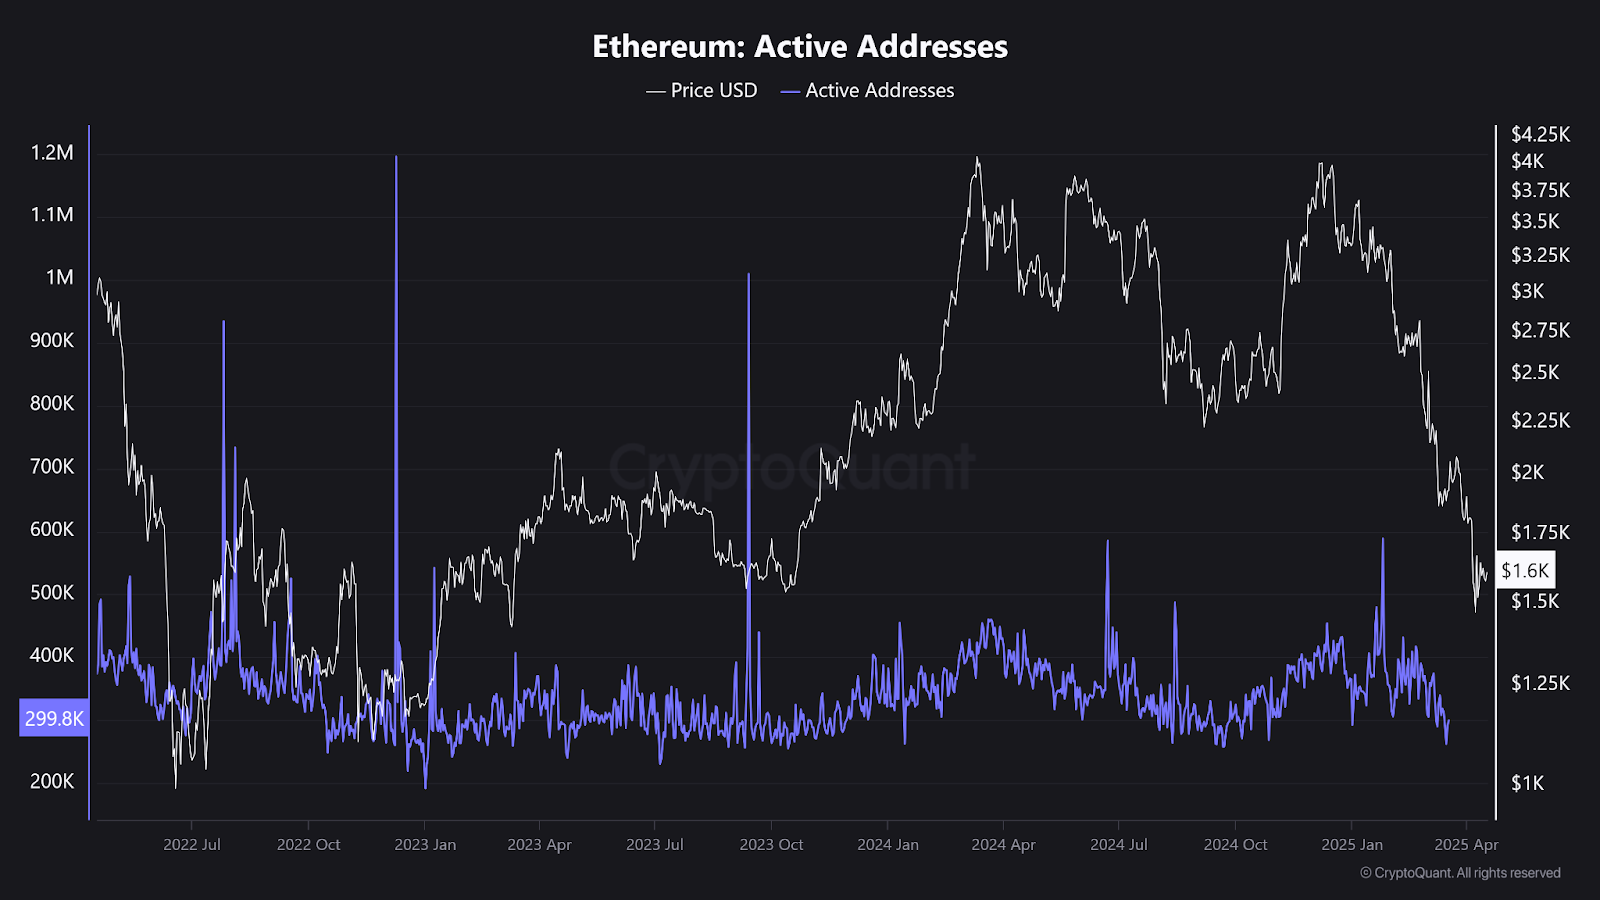
On-chain data from Cryptoquant shows Ethereum active addresses have also shown a declining trajectory, dropping below 300,000 in recent days. Lower user activity is accompanied by a decline in the price trend, with ETH dropping below the $2,000 psychological level and failing to make a rebound.

The current Coinglass chart shows that the net flow has been negative over the past three months due to outflows that are higher than inflows. However, recent deposits have slightly distorted that equation among the whales.

Large outflows are generally associated with long-term investments, while the sharp move in the opposite direction suggests rising asset sales. ETH is down more than 30% from its March high and stands at $1,612 currently.
On the daily chart, TradingView analysis reveals that Ethereum is now operating slightly higher than the 9-day simple moving average of $1,600. The RSI is still at 41.71, which indicates that the momentum is weak but is rising. The chart shows a small increase; however, the $1,670 level still remains unbroken.

Analysts Remain Split on ETH’s Next Move
While such trends cause much concern and confusion among some investors, some analysts maintain a bullish stance. Trader Ted believes that ETH may be able to reverse a short-term bearish trend and close above $1,670. If successful, then it would provide a boost of $2,000. Likewise, Titan of Crypto identifies an ascending triangle on the weekly chart, a bullish pattern that often develops before a breakout.
Others urge caution. IncomeSharks discouraged aggressive dip-buying forms, stating that taking profits on rallies during the prevailing cycle was wiser. CrypNuevo reiterated a slightly bullish sentiment, stating that Ethereum has favorable factors, such as a strong Bitcoin influence.
He reported large spot purchases between $1,550 and $1,700. Analyst Belle is also positive about ETH recovery due to support levels and a positive weekly chart . Ethereum’s price in the short term remains unpredictable as it largely depends on investor sentiment toward recent whale moves.

BTC ETFs Record Notable Inflows on 18th April, ETH Sees Hefty Outflows
As per Lookonchain, Bitcoin ETFs have cumulatively added 1,147 $BTC while Ethereum ETFs have gone th...

Kalp and SFT Protocol Unite to Boost RWA Tokenization and DePIN Innovation
Kalp and SFT Protocol are collaborating to scale Real World Asset (RWA) tokenization, ensuring secur...

Altcoin Season Buzz Builds as Bitcoin Dominance Hits Critical Resistance
Altcoin season hopes rise as Bitcoin dominance hits key resistance, but Fed policy and liquidity con...

