Bullish Breakout On The Ethereum 4-Hour Chart Says Price Is Headed For $2,500


Ethereum has faced intense selling pressure over the past few weeks, with its price falling below the $2,000 threshold. This intense run of declines saw the cryptocurrency reach a low of $1,750 on March 11, marking its lowest point since November 2023. However, despite this steep drop, a new technical setup suggests Ethereum could be on the verge of a bullish turnaround , as it now retests a key resistance level on the 4-hour chart.
Ethereum Retests Critical Resistance After Rebound
Ethereum’s price action has been full of downtrends and many investors exiting their positions since the beginning of March. As such, Ethereum broke finally below $2,000 on March 10 after support failed to hold, and has spend the past week trading below this level.
Although after sinking to $1,750, Ethereum has shown signs of recovery and has now rebounded to around $1,900. This little price action of recovery has brought the cryptocurrency back to a downward-sloping resistance trendline, a level that has acted as a barrier to brief upward movements of accumulations during the recent downtrend.
The test of this resistance now presents a potential breakout scenario where bullish momentum flows into Ethereum. An analyst on TradingView highlighted this setup, noting that a breakout above the resistance trendline could open the doors for a significant rally above $2,000.
Analyst Sets Bullish Price Targets For ETH
Despite the prevailing bearish sentiment that continues to weigh heavily on the broader crypto market, a TradingView analyst has identified a bullish trade setup on Ethereum’s 4-hour candlestick chart. This suggests that despite the recent decline, there remains a degree of optimism among some analysts and investors who believe Ethereum could soon regain its bullish footing.
According to the analysis, a confirmed breakout above $1,885 could serve as an ideal entry point. At the time of writing, Ethereum is yet to break above the downward sloping resistance trendline, as the breakout point is currently set just below $2,000. If Ethereum were to eventually break above the resistance, the analyst noted a probable price target of $2,596.
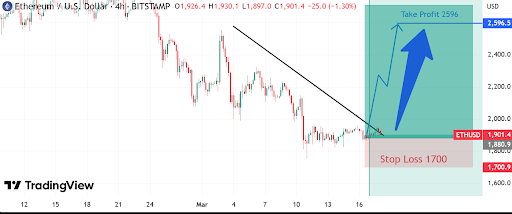
On the flip side, the analysis advices placing a stop loss at $1,700, meaning the setup is structured to manage risk while aiming for substantial gains. This is in case if the bearish momentum is too great to be overcome, and the Ethereum price gets rejected again at the resistance trendline. Given the high-risk reward ratio, the analyst advised watching for a surge in volume, which would provide confirmation that Ethereum is breaking out with momentum.
At the time of writing, Ethereum is trading at $1,895. Price action in the past 24 hours saw Ethereum reach an intra-day high of $1,950 before rejecting. However, the leading altcoin is still rolling around this resistance trendline, and there is a chance of a push upward again in the next 48 hours.

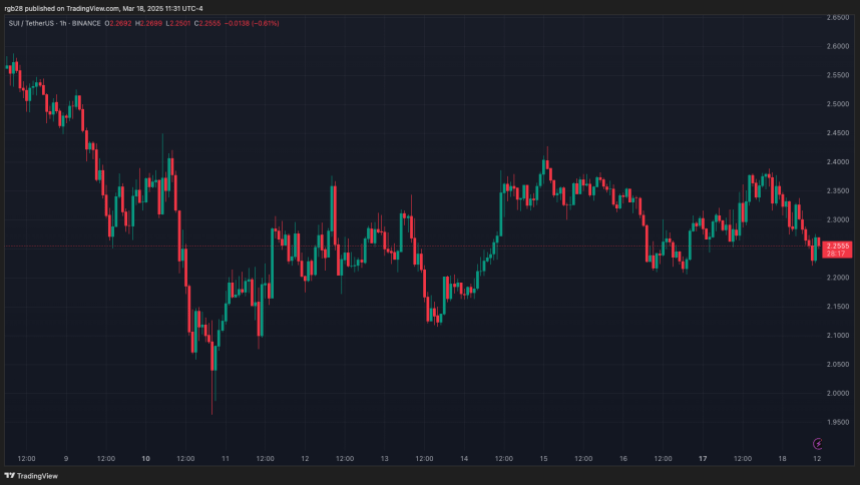
SUI Ready For 15% Move Amid Key Level Retest – Breakout Or Breakdown Ahead?
SUI, the Sui Network’s native token, is retesting a key support level after surging near the $2.40 m...
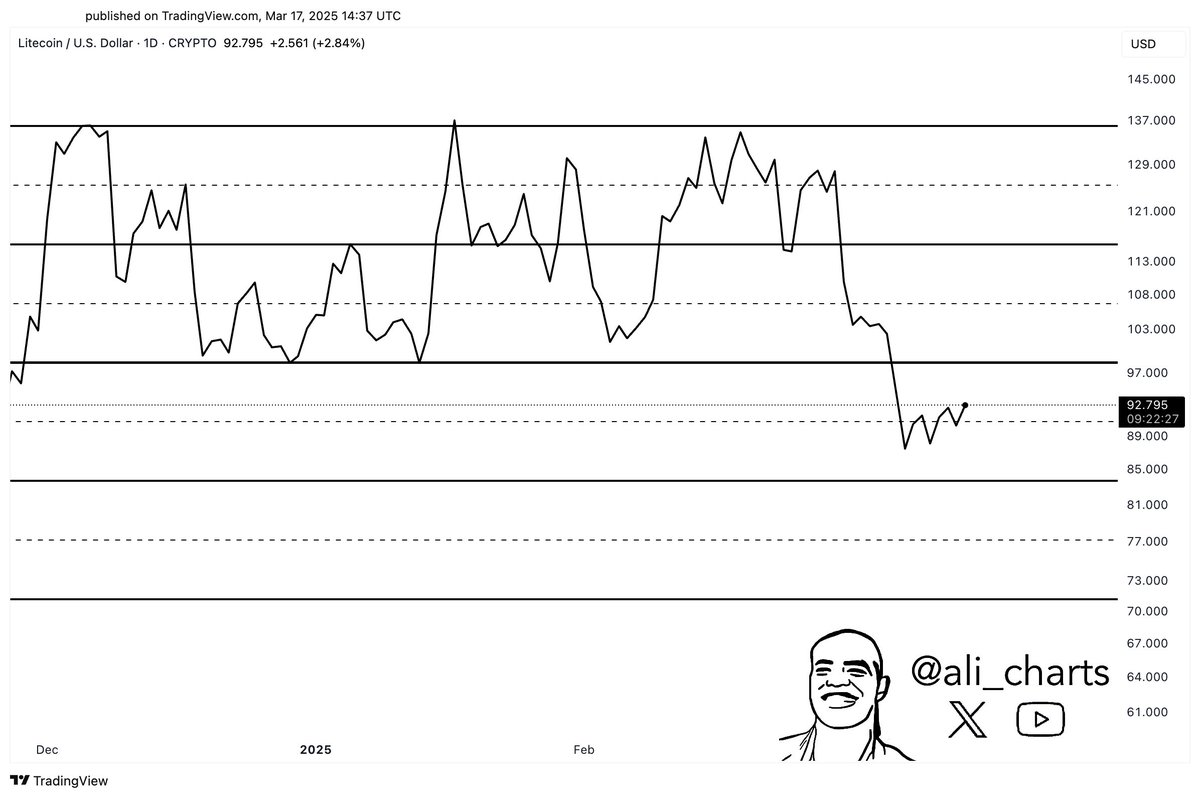
Litecoin Breaks Under Parallel Channel: Analyst Predicts This Target
An analyst has pointed out how Litecoin has slipped under a parallel channel recently and could be s...

XRP Vs. ETH: Bold Prediction Claims ‘Dying’ Ethereum’s Reign Is Ending
A cryptocurrency expert thinks that XRP might overtake Ethereum in market value in the next three mo...