XRP Price Reclaims Ground—Is a Bigger Push Just Getting Started?


XRP price started a fresh recovery wave above the $2.250 zone. The price is now consolidating and might clear the $2.4650 resistance zone.
- XRP price started a fresh recovery wave above the $2.320 resistance zone.
- The price is now trading above $2.350 and the 100-hourly Simple Moving Average.
- There was a break above a connecting bearish trend line with resistance at $2.40 on the hourly chart of the XRP/USD pair (data source from Kraken).
- The pair might continue to move up if it clears the $2.4650 resistance zone.
XRP Price Eyes Breakout
XRP price remained supported and started a recovery wave above the $2.20 zone, like Bitcoin and Ethereum . The price was able to clear the $2.250 and $2.320 resistance levels.
The bulls were able to push the price above the 23.6% Fib retracement level of the downward move from the $2.581 swing high to the $2.354 low. Besides, there was a break above a connecting bearish trend line with resistance at $2.40 on the hourly chart of the XRP/USD pair.
The price is now trading above $2.320 and the 100-hourly Simple Moving Average. On the upside, the price might face resistance near the $2.450 level. The first major resistance is near the $2.4650 level or the 50% Fib retracement level of the downward move from the $2.581 swing high to the $2.354 low.
The next resistance is $2.50. A clear move above the $2.50 resistance might send the price toward the $2.550 resistance. Any more gains might send the price toward the $2.650 resistance or even $2.6650 in the near term. The next major hurdle for the bulls might be $2.80.
Another Drop?
If XRP fails to clear the $2.4650 resistance zone, it could start another decline. Initial support on the downside is near the $2.400 level and the trend line. The next major support is near the $2.350 level.
If there is a downside break and a close below the $2.350 level, the price might continue to decline toward the $2.320 support. The next major support sits near the $2.250 zone.
Technical Indicators
Hourly MACD – The MACD for XRP/USD is now gaining pace in the bullish zone.
Hourly RSI (Relative Strength Index) – The RSI for XRP/USD is now above the 50 level.
Major Support Levels – $2.40 and $2.350.
Major Resistance Levels – $2.4650 and $2.50.
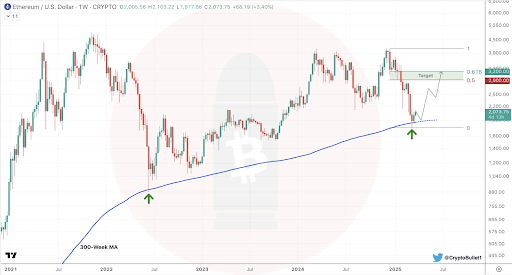
Ethereum Price Hits 300-Week MA For The Second Time Ever, Here’s What Happened In 2022
Ethereum has once again fallen below the $2,000 mark, a psychological level it had briefly reclaimed...

Pi Coin Sinks 47% In 14 Days—What’s Behind The Massive Drop?
Pi Network, once a well-loved crypto project among millennial investors, is in freefall. With the pr...
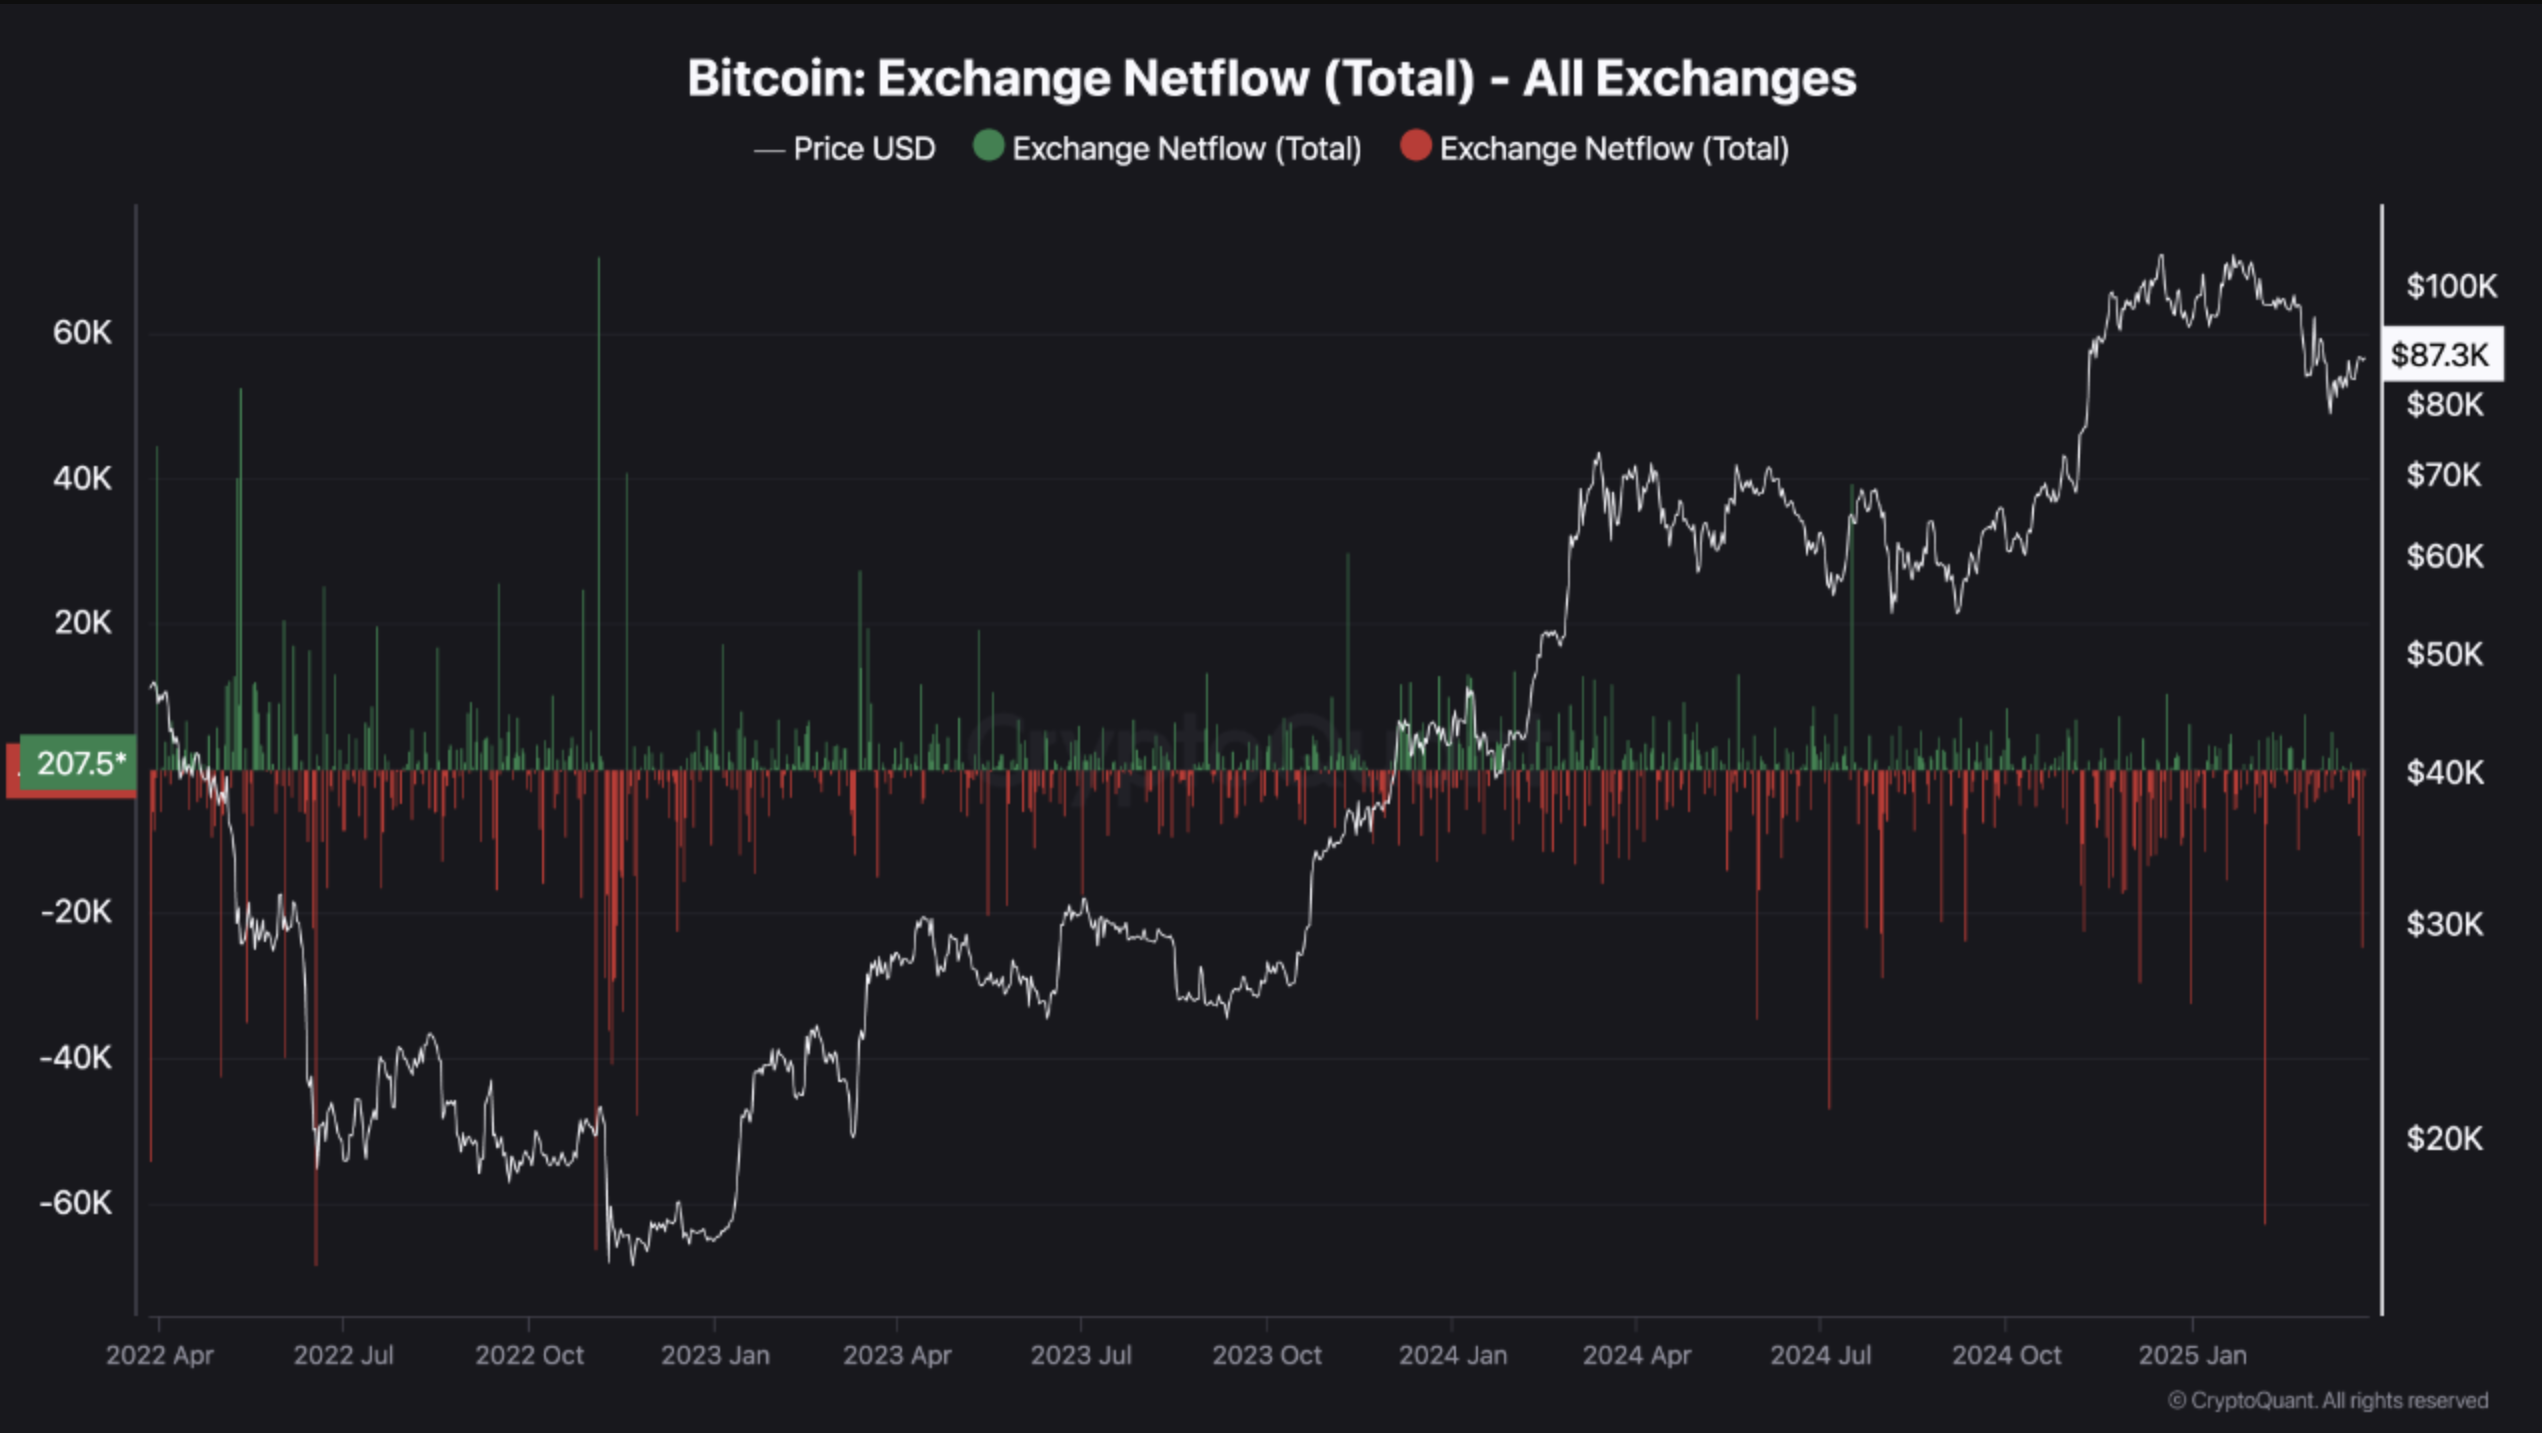
Is a Bitcoin Rally Coming? Exchange Net Flow Data Suggests So
According to a CryptoQuant Quicktake post published earlier today, Bitcoin (BTC) may be on the verge...