Bitcoin Keeps Rebounding—But Is Momentum Really Turning Bullish?


Bitcoin has seen yet another bounce in the past day, adding to the recent series of rebounds. Here’s what on-chain data says regarding if BTC is going anywhere with them.
Bitcoin Realized Profit/Loss Ratio Could Shed Light On Broader Dynamics
In its latest weekly report, the on-chain analytics firm Glassnode has discussed about the recent trend in the Realized Profit/Loss Ratio for Bitcoin, which is an indicator that can be useful to study how investors are reacting to price volatility.
The metric measures, as its name already suggests, the ratio between the amount of profit and that of loss being realized by the holders or addresses as a whole.
The indicator works by looking at the transaction history of each coin being sold on the network to find what price it was transferred at prior to this sale. If this previous selling value is less than the latest spot price for any token, then the metric includes it under the profit volume.
The total profit realized in the sale of the coin is assumed to be equal to the difference between the two prices. The indicator calculates this value for all coins belonging to the profit volume and takes a total sum to determine the scale of profit realization happening across the blockchain.
Similarly, the Realized Profit/Loss Ratio also finds the total amount of loss being realized by referring to the sales of the coins of the opposite type (that is, the tokens with the last transaction value higher than the current spot price). Then, it takes the ratio between the two sums, to estimate the net situation for the sector.
During the last couple of months, Bitcoin has been going through a phase of bearish price action. Here’s what investor trading behavior has been like in this period, according to the Realized Profit/Loss Ratio:

As the analytics firm has highlighted in the chart, the indicator has seen dips under the 1 mark during each of BTC’s recent lows. A value in this region corresponds to loss-taking being more dominant than profit-taking.
“This imbalance typically marks a degree of seller exhaustion, where downside momentum fades as sell-side pressure is absorbed,” explains Glassnode. Due to this reason, capitulation tends to help BTC arrive at local bottoms.
From the graph, it’s visible that the cryptocurrency also benefited from this effect during the recent bursts of loss realization, as its price found a rebound following each of them.
These Bitcoin rebounds, however, have so far not been anything sustained. Will they eventually culminate into a return of proper bullish momentum, or are they only dead-cat bounces on the way down? To tackle the question, the analytics firm has referred to a long-term view of the Realized Profit/Loss Ratio.

As shown in the above chart, the 90-day simple moving average (SMA) of the Bitcoin Realized Profit/Loss Ratio has been sharply trending down recently, despite the jumps in profit realization that have come on the short-term view.
“These brief profit-driven surges have failed to reverse the broader downtrend, suggesting that the macro picture remains one of generally weaker liquidity and deteriorating investor profitability,” notes Glassnode.
So, as for whether Bitcoin has been witnessing a shift towards bullish momentum with the recent rebounds, the answer is seemingly no, at least from the perspective of the Realized Profit/Loss Ratio.
BTC Price
At the time of writing, Bitcoin is trading around $83,600, down almost 2% in the last seven days.


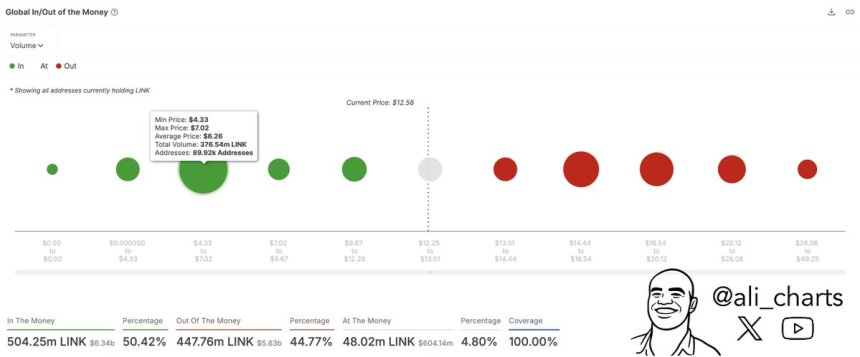
Massive Chainlink Demand Wall At $6.26 As 90K Investors Buy 376M LINK
Chainlink is currently trading at critical demand levels as the broader crypto market faces ongoing ...

Bitcoin’s Most Critical Support Level At $69,000 — Here’s Why
The price of Bitcoin made a strong start to the month of April, reaching as high as $87,000 on Wedne...

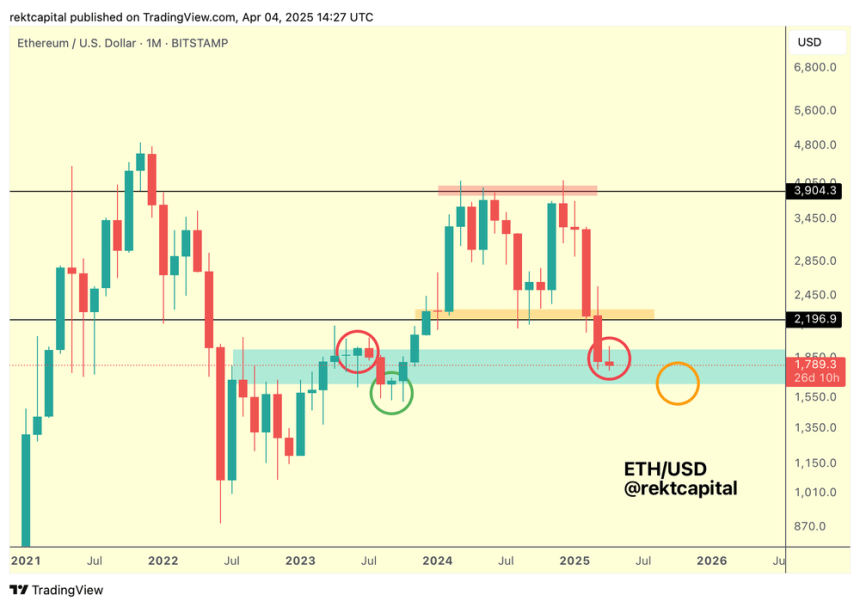
Ethereum Risks Drop To $1,550 If It Doesn’t Reclaim Key Resistance – What’s Next For ETH?
Ethereum (ETH) has seen a 17% drop in the last month, trading below $1,850 for the past few days. Am...

