Bitcoin Price Could Reclaim $95,000 — But Watch Out For This Resistance Level


It’s been exactly a month since the Bitcoin price lost the $90,000 level, falling to around $77,000 in a single move. The premier cryptocurrency has yet to recover from this downturn, struggling to break out of the $82,000 – $87,000 range over the past few weeks.
As of this writing, the price of Bitcoin is hovering around the $83,000 level, reflecting a mere 1% decline in the past 24 hours. According to data from CoinGecko, BTC’s value has barely changed over the past seven days.
Here’s How Bitcoin Price Could Jump 15%
Popular crypto analyst Ali Martinez took to the X platform to share an exciting analysis of the price of Bitcoin. According to the online pundit, the market leader seems primed for a 15% move to the upside over the coming days.
This bullish prediction is based on the formation of a symmetrical triangle on the four-hour Bitcoin price chart. The symmetrical triangle is a technical analysis pattern characterized by a diagonal falling upper trendline (connecting the swing highs) and a diagonally rising lower trendline (along the swing lows).
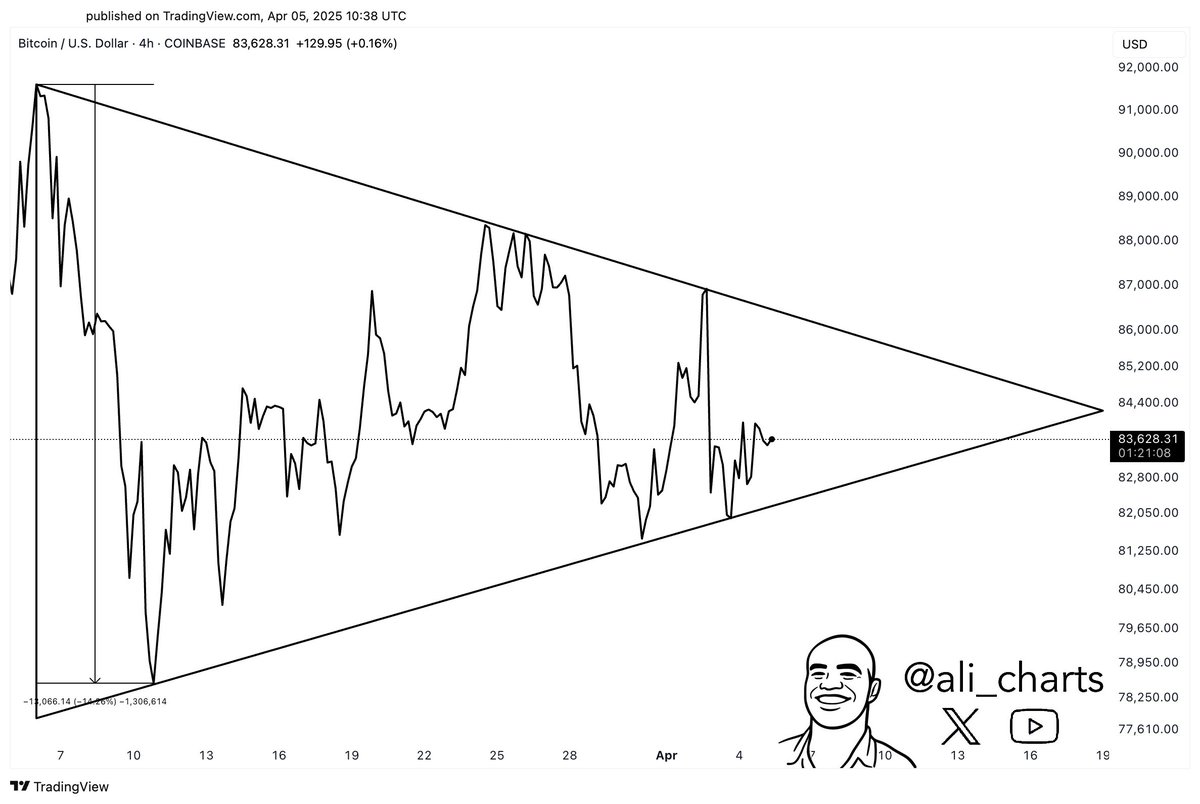
With its price narrowing towards the apex of the triangle, there is a likelihood that BTC will breach the upper trendline for a breakout. According to Martinez, if the Bitcoin price successfully breaks out of this pattern, investors could see the premier cryptocurrency register a bullish 15% move to around $95,000.
$87,000 Could Prove Pivotal To This BTC Move
Martinez revealed in a separate post that the Bitcoin price might need to overcome a major resistance level to resume its bull run. This is based on the formation of a “confluence zone,” which represents a price range where multiple technical resistance levels meet.
This confluence range seemingly forming on the daily timeframe of the Bitcoin price chart would consist of the 50-day and 200-day moving averages (MAs) and a descending trendline. The 50-day moving average acts as a gauge of short- to mid-term trend direction and as a dynamic support and resistance level.
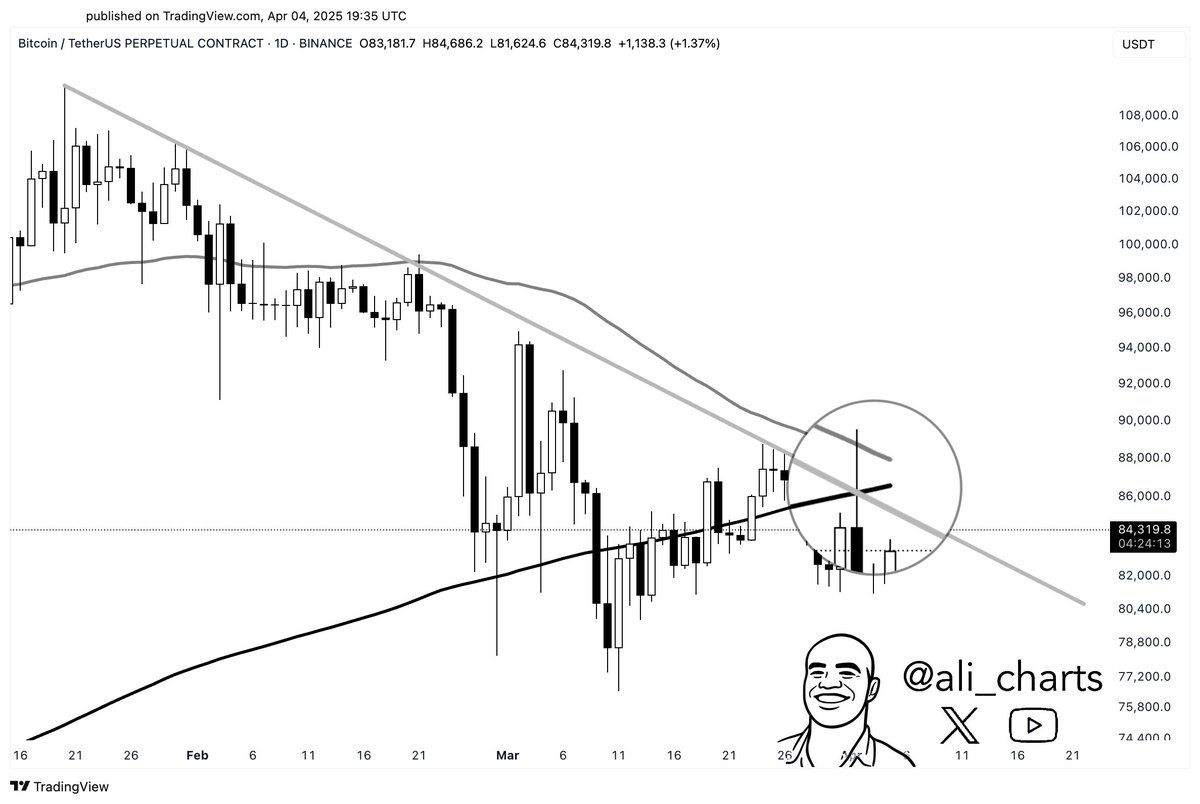
Similarly, the 200-day MA is used as a long-term trend indicator, with a break above it considered a major bullish reversal signal. Meanwhile, the Bitcoin price has been forming lower highs (connected by a descending trendline) since reaching the all-time high of $108,786.
As mentioned earlier, the Bitcoin price has been trading in a consolidation range over the past few weeks, with the bulls unable to make a sustained upward run. However, the recent show of strength in the face of growing macroeconomic uncertainty somewhat strengthens a bullish case for the flagship cryptocurrency.
In any case, investors might want to pay extra attention to $87,000, as the convergence of three technical resistance indicators increases the likelihood of a price rejection at the level. Moreover, the Bitcoin price had already tried breaching this mark in the past week before correcting back to around $82,000.

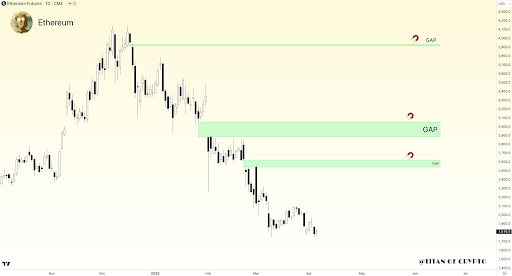
Ethereum Price Looks Set To Crash To $1,000-$1,500, But Can It Fill The CME Gaps Upwards To $3,933
Ethereum is facing renewed downward selling pressure, with the entire crypto market entering a fresh...
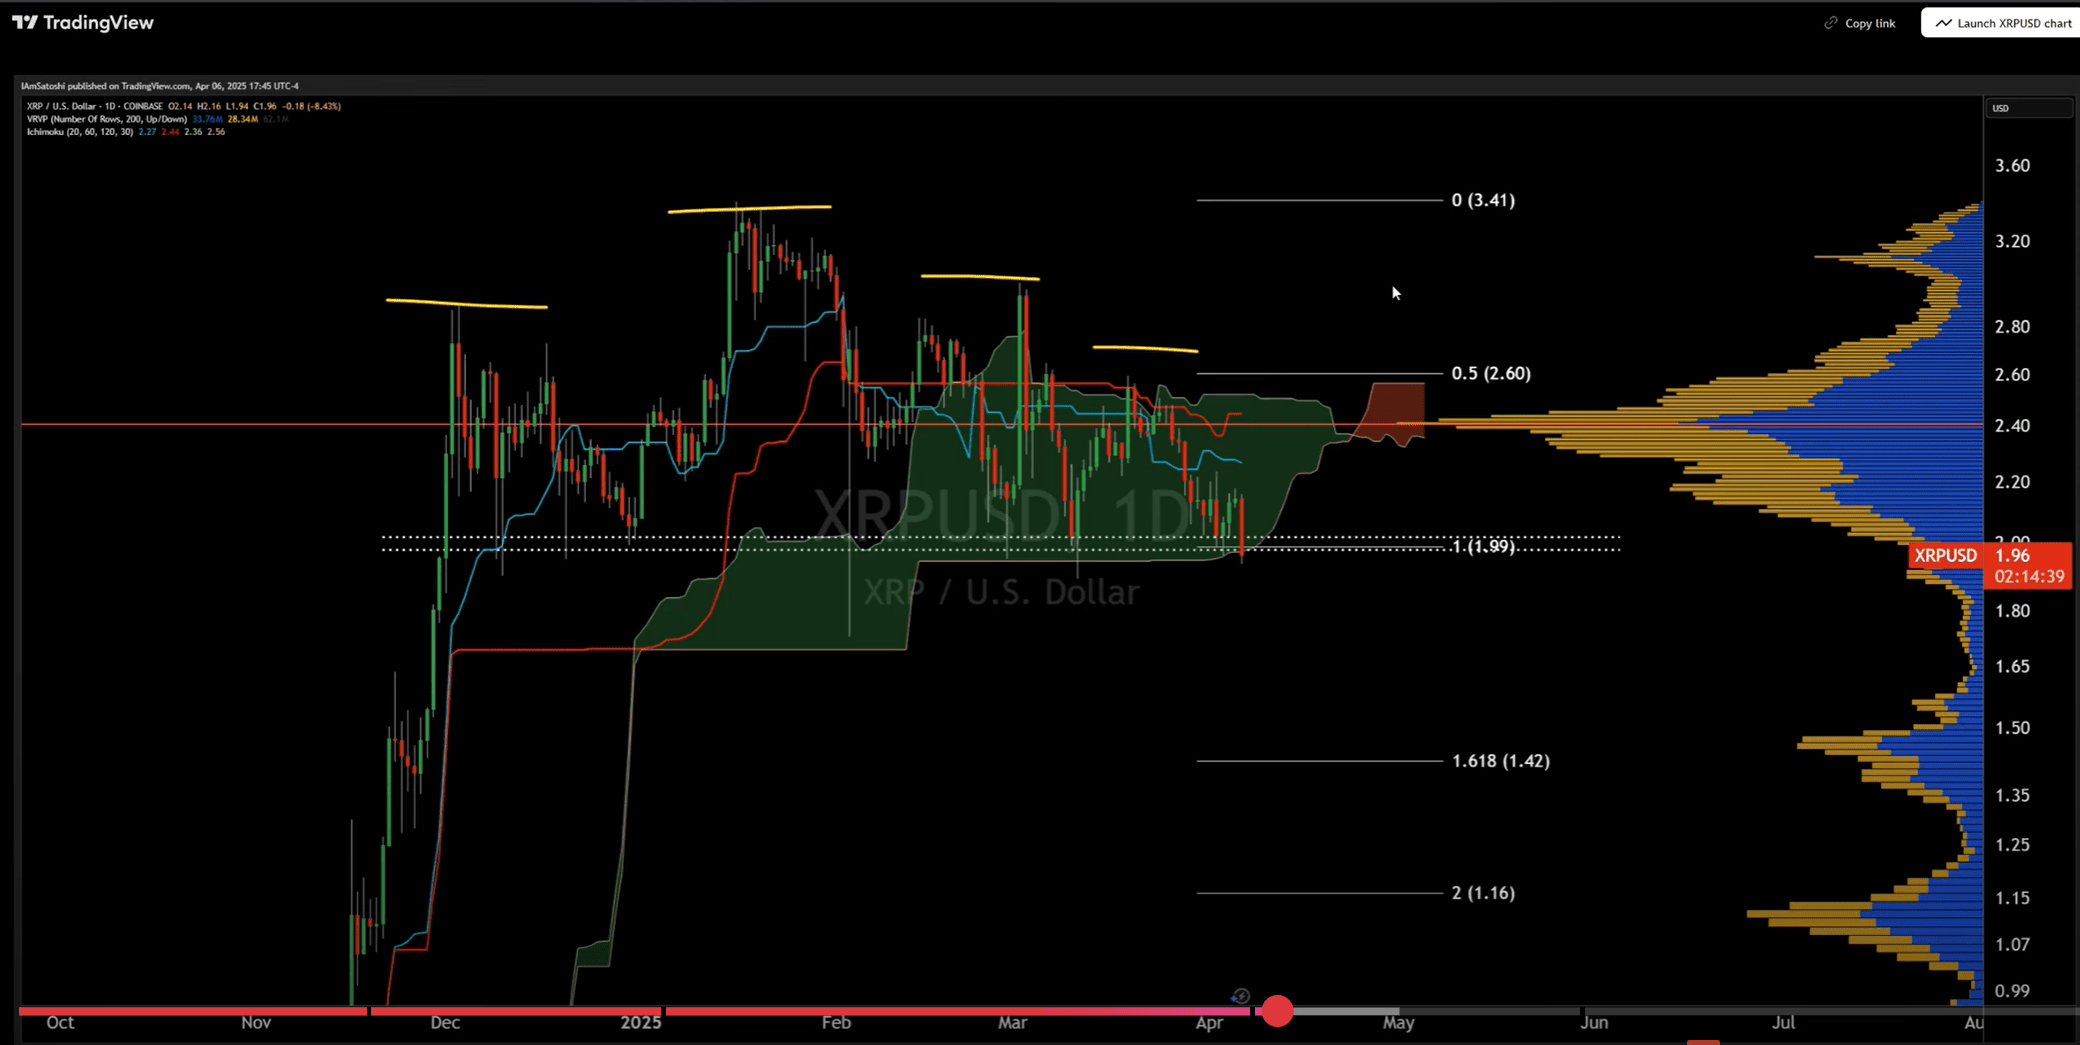
XRP Confirms Head And Shoulders Breakdown: How Low Can It Go?
Amidst the broader crypto market crash, XRP has broken below an important support zone that several ...
Ethereum Capitulation May Be Nearing End – Will A Fed Pivot Spark A Recovery?
Ethereum has extended its downtrend, setting fresh lows around $1,400 — a level not seen since early...