Bitcoin Faces Crucial Technical Test in Prolonged Downtrend


- BTC nears $90K resistance as bearish momentum shows signs of weakening.
- Bullish RSI divergence and falling wedge hint at potential breakout.
- Persistent exchange outflows suggest long-term holder confidence remains strong.
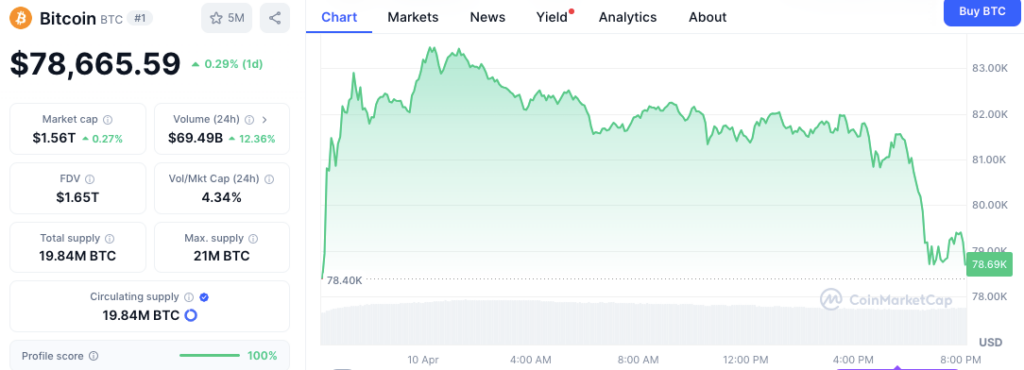
Bitcoin (BTC) is approaching a resistance level near $90,000 as the leading cryptocurrency shows early signs of weakening bearish momentum. Despite trading within a downtrend pattern since February 2025, recent technical indicators suggest that sellers may be losing control. On April 10, 2025, BTC experienced notable intraday volatility, surpassing $82,000 before falling back to $78,665.59, according to CoinMarketCap data.
BTC’s market capitalization increased slightly by 0.27% to $1.56 trillion, while the 24-hour trading volume surged 12.36% to $69.49 billion. The heightened trading activity reflects growing market engagement amid price fluctuations. The volume-to-market cap ratio stands at 4.34%, indicating moderate liquidity conditions.

Bitcoin’s price opened near $78,400 and climbed to an intraday high close to $83,000 before sellers reasserted control. This led to a retreat back to the $78,000 range, where BTC stabilized in the later hours of the trading session. The circulating supply currently stands at 19.84 million BTC, nearing its maximum cap of 21 million coins. The fully diluted valuation (FDV) is recorded at $1.65 trillion.
Bullish Divergence and Falling Wedge Signal Potential Reversal
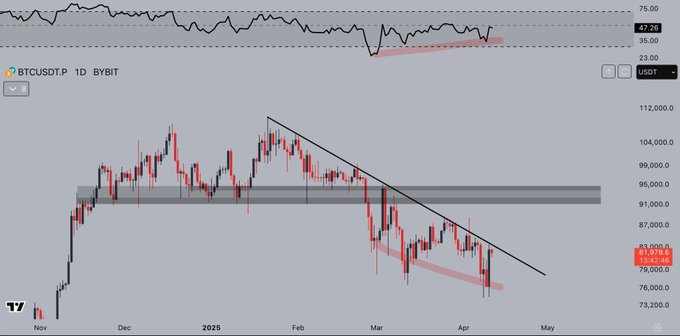
Crypto analyst Jelle highlighted that Bitcoin’s latest price movement is testing a descending trendline that has served as resistance since early 2025. While BTC remains below this trendline, technical patterns indicate growing bullish momentum.
The Relative Strength Index (RSI) on the daily chart has formed higher lows, even though the price has recorded lower ones. This bullish shift often signals weakening sell-side pressure and possible price reversals.
Additionally, a falling wedge pattern is visible within the recent price structure. Falling wedges, especially when supported by bullish divergence, are commonly associated with upside breakouts. The RSI has also climbed above a resistance zone near the 47 level, suggesting increasing buyer interest.

Currently, BTC is approaching a horizontal resistance between $90,000 and $92,000 that lies along the descending trendline. A breakout above this confluence area could turn out to be a signal for the start of a bullish reversal. However, until the price breaks above the cloud a downtrend is still prevailing.
Exchange Flows Show Long-Term Bullish Trend
Data from Coinglass shows that Bitcoin’s spot exchange flows have maintained a strong net outflow trend since mid-2023. This sustained dominance of outflows over inflows indicates that investors are moving BTC off exchanges, commonly interpreted as a signal of long-term holding behavior.

Major outflows were recorded during periods of market volatility, particularly in late December 2023, early February 2024, and March 2025. These movements coincided with corrections in BTC price, as investors appeared to shift assets into cold storage.
The market observed brief inflow spikes during early November 2023 and late February 2025 which preceded minor price declines because the selling pressure escalated at those times.

BTC ETFs Record Notable Inflows on 18th April, ETH Sees Hefty Outflows
As per Lookonchain, Bitcoin ETFs have cumulatively added 1,147 $BTC while Ethereum ETFs have gone th...

Kalp and SFT Protocol Unite to Boost RWA Tokenization and DePIN Innovation
Kalp and SFT Protocol are collaborating to scale Real World Asset (RWA) tokenization, ensuring secur...

Altcoin Season Buzz Builds as Bitcoin Dominance Hits Critical Resistance
Altcoin season hopes rise as Bitcoin dominance hits key resistance, but Fed policy and liquidity con...

