Bitcoin Faces Triple Resistance As Price Rejection Persists


Over the past trading week, Bitcoin (BTC) failed to make any significant price breakout, experiencing rejections at the $86,000 price region. While the market suffered no major price pullback, the high level of sideways price movement indicates a strong investor uncertainty.
Interestingly, popular market analyst with X username Daan Crypto has provided an insightful technical analysis on the BTC market, highlighting the present barriers that are restricting an upward price movement.
Bitcoin Multiple Barriers: 200-Day EMA, 200-Day MA, And Diagonal Trendline In Focus
Since hitting a new all-time high in late January, Bitcoin has slipped into heavy correction, losing over 22% of its market price. The majority of the price loss has been linked to international trade tariff crises, which have forced investors to seek relief in less risky assets.
However, a pause in new tariffs and an onset in global negotiations soon accompanied a price rebound seen in early April. Albeit, Bitcoin is now struggling to break out of the $84,000-$86,000, forming a tight consolidation range.
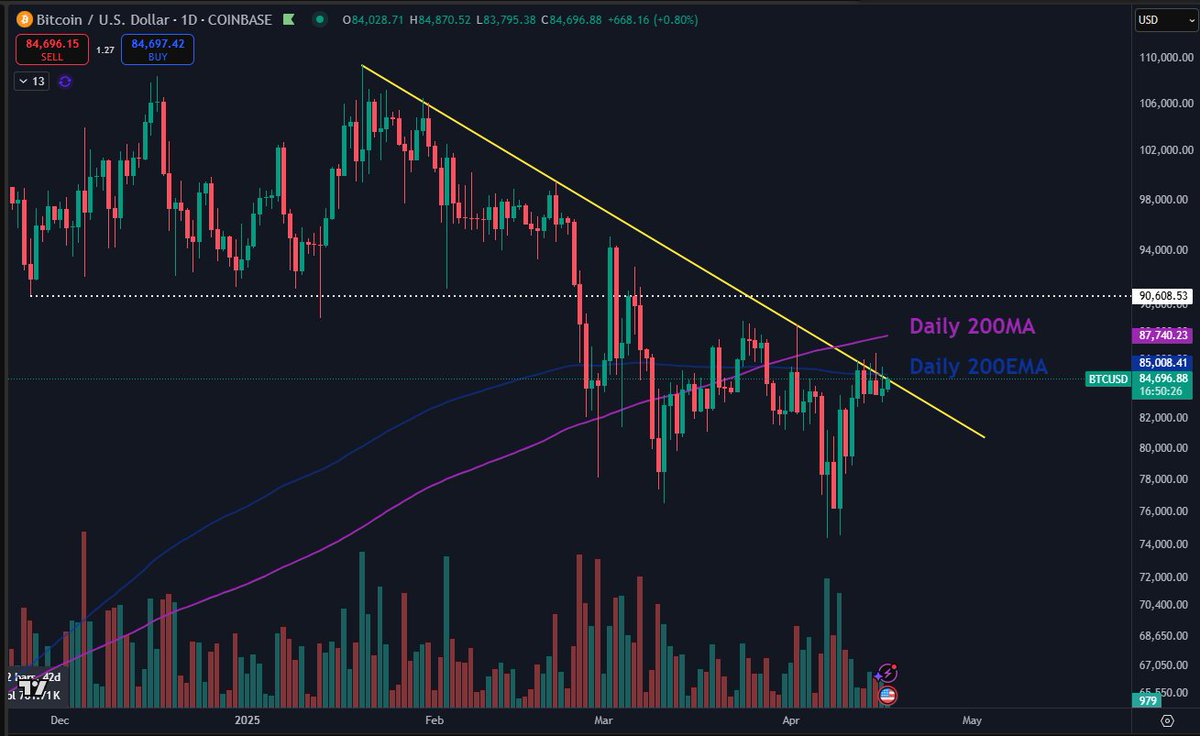
In performing a technical analysis on the current BTC market, Daan Crypto has identified the three resistance factors that have been active in the specified price zone.
The first price opposition is a diagonal downtrend line formed by Bitcoin’s consistent lower lows and lower highs amidst the price correction in the past three months. To establish any intent of a trend reversal, Bitcoin bulls must force a convincing price breakout above this long-standing diagonal resistance.
Other critical indicators are the 200-day Exponential Moving Average (EMA) and 200-day Simple Moving Average (MA), both of which provide an average of the past 200 days’ prices, with the EMA giving more weight to recent prices.
The 200-day EMA is important in spotting medium-to-long-term trend changes as it reacts faster to any price change than the 200-day MA, which is a classic long-term indicator. However, Bitcoin must move above both indicators to break out of its consolidation and perhaps experience a full price recovery.
Bitcoin Ultimate Resistance At $90,000-$91,000
Despite Bitcoin’s struggles in the $84,000-$86,000 price zone, Daan Crypto has warned that the asset’s ultimate test of a price reversal is at the $90,000-$91,000 price range, which served as a key support in the earlier phase of the bull cycle.
A successful reclaim of this range would place Bitcoin back into the bullish trading zone, signaling a potential resumption of the broader bull market. At press time, BTC continues to trade at $84,868 following a 0.13% gain in the past day. Meanwhile, the daily trading volume is down by 42.34% and valued at $12.52 billion.

Solana Price Surges Toward $140 — Here’s The Resistance Level To Watch
The Solana price was one of the few highlights in a generally choppy crypto market over the past wee...

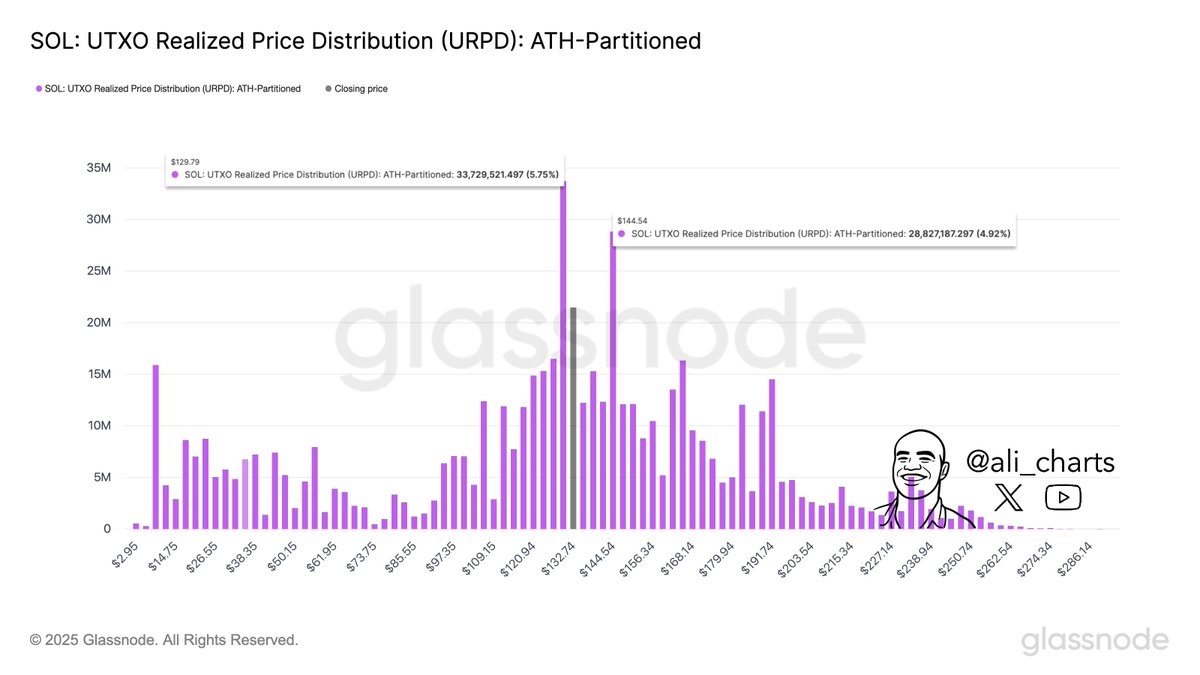
Solana Price At Crossroads: $129 Support, $144 Resistance Set Stage For Next Big Move
Solana’s price action over the past 24 hours has been marked by a decisive move above the $135 level...
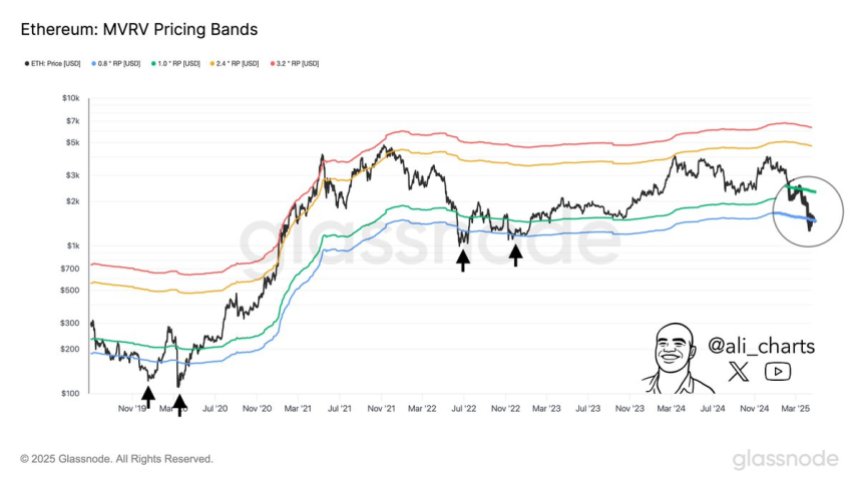
Ethereum Enters Historic Buy Zone As Price Dips Below Key Level – Insights
Ethereum is currently trading at a critical resistance level as bulls attempt to regain momentum and...