BNB Price Reclaims $600 — Is This the Start of a Major Upside Move?


BNB price is rising from the $580 support zone. The price is now consolidating gains above $600 and might aim for more gains in the near term.
- BNB price is attempting to recover above the $615 resistance zone.
- The price is now trading above $600 and the 100-hourly simple moving average.
- There is a connecting bullish trend line forming with support at $611 on the hourly chart of the BNB/USD pair (data source from Binance).
- The pair must stay above the $600 level to start another increase in the near term.
BNB Price Eyes More Upsides
After forming a base above the $580 level, BNB price started a fresh increase. There was a move above the $595 and $600 resistance levels, like Ethereum and Bitcoin .
The bulls even pushed the price above the $610 level. A high was formed at $620 before there was a minor downside correction. The price dipped below the 23.6% Fib retracement level of the upward move from the $594 swing low to the $620 high.
The price is now trading above $600 and the 100-hourly simple moving average. There is also a connecting bullish trend line forming with support at $611 on the hourly chart of the BNB/USD pair.
On the upside, the price could face resistance near the $618 level. The next resistance sits near the $620 level. A clear move above the $620 zone could send the price higher. In the stated case, BNB price could test $635. A close above the $635 resistance might set the pace for a larger move toward the $650 resistance. Any more gains might call for a test of the $665 level in the near term.
Another Decline?
If BNB fails to clear the $620 resistance, it could start another decline. Initial support on the downside is near the $611 level. The next major support is near the $607 level and the 50% Fib retracement level of the upward move from the $594 swing low to the $620 high.
The main support sits at $600. If there is a downside break below the $600 support, the price could drop toward the $585 support. Any more losses could initiate a larger decline toward the $580 level.
Technical Indicators
Hourly MACD – The MACD for BNB/USD is gaining pace in the bullish zone.
Hourly RSI (Relative Strength Index) – The RSI for BNB/USD is currently above the 50 level.
Major Support Levels – $611 and $607.
Major Resistance Levels – $618 and $620.
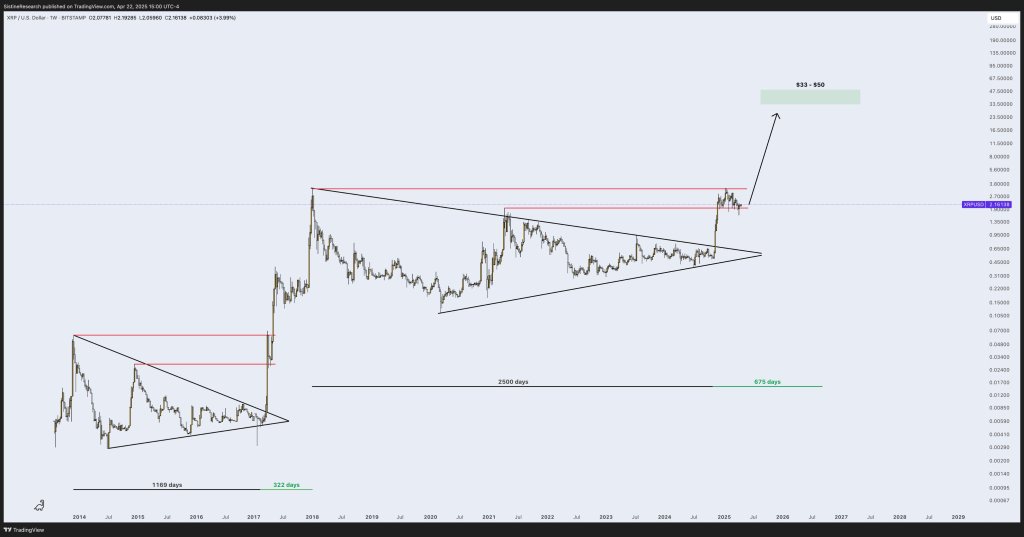
XRP Targets $33 To $50 By September 2027, Research Firm Says
Trading-desk watchers received a fresh dose of long-term optimism for X on Tuesday after crypto anal...
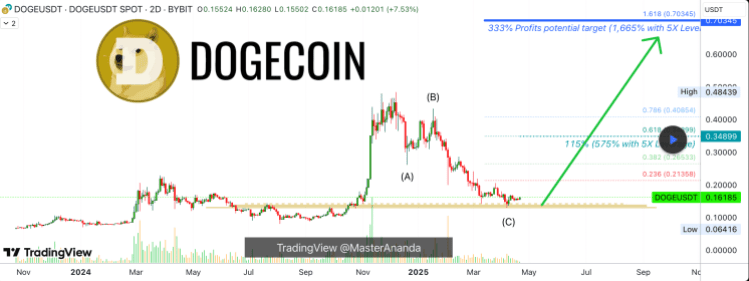
Dogecoin Price Rebound: Why DOGE Is On The Verge Of 333% Rally Toward $0.7
Dogecon continues to look toward a rebound despite the market sentiment. This has been strengthened ...
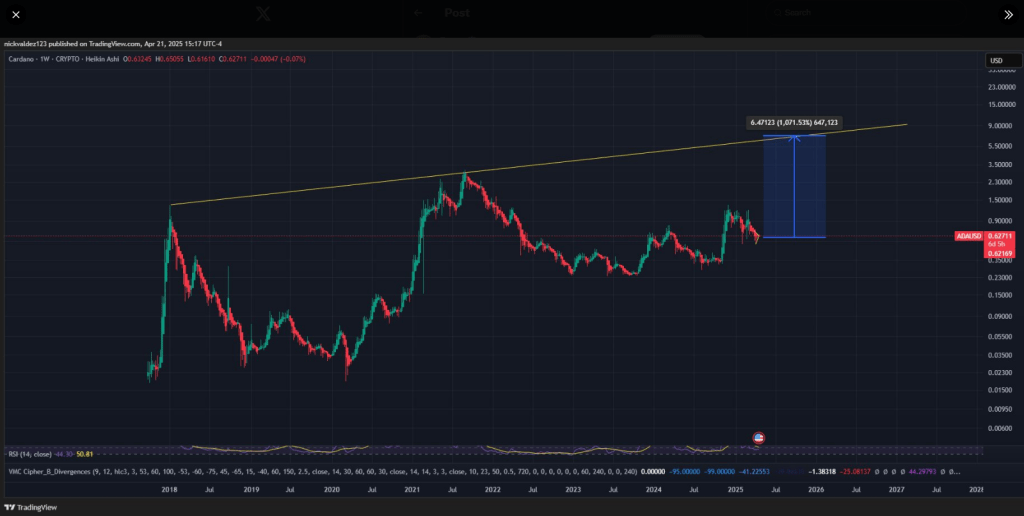
Cardano Set For 1,000% Explosion? Analyst Says ‘Just HODL’
Cardano (ADA) may experience explosive price appreciation in the near future, with some experts proj...