Dogecoin (DOGE) Pulls Back — Is A Bounce from $0.1650 Support on the Horizon?


Dogecoin started a fresh increase above the $0.1700 zone against the US Dollar. DOGE is now correcting gains and might find bids near the $0.1650 zone.
- DOGE price started a decent upward move above the $0.1700 level.
- The price is trading above the $0.1650 level and the 100-hourly simple moving average.
- There was a break below a key bullish trend line with support at $0.1760 on the hourly chart of the DOGE/USD pair (data source from Kraken).
- The price could start a fresh increase if it clears the $0.1800 resistance zone.
Dogecoin Price Corrects Gains
Dogecoin price started a fresh increase above the $0.1650 resistance , like Bitcoin and Ethereum . DOGE climbed above the $0.1700 and $0.1800 resistance levels before the bears appeared.
A high was formed at $0.1852 and the price started a downside correction. There was a move below the $0.180 and $0.1750 levels. The price dipped below the 23.6% Fib retracement level of the upward move from the $0.1558 swing low to the $0.1852 high.
There was also a break below a key bullish trend line with support at $0.1760 on the hourly chart of the DOGE/USD pair. Dogecoin price is now trading above the $0.170 level and the 100-hourly simple moving average.
Immediate resistance on the upside is near the $0.1780 level. The first major resistance for the bulls could be near the $0.180 level. The next major resistance is near the $0.1850 level. A close above the $0.1850 resistance might send the price toward the $0.1920 resistance. Any more gains might send the price toward the $0.1980 level. The next major stop for the bulls might be $0.200.
Another Decline In DOGE?
If DOGE’s price fails to climb above the $0.180 level, it could start another decline. Initial support on the downside is near the $0.1720 level. The next major support is near the $0.1705 level and the 50% Fib retracement level of the upward move from the $0.1558 swing low to the $0.1852 high.
The main support sits at $0.1650. If there is a downside break below the $0.1650 support, the price could decline further. In the stated case, the price might decline toward the $0.1550 level or even $0.1450 in the near term.
Technical Indicators
Hourly MACD – The MACD for DOGE/USD is now losing momentum in the bullish zone.
Hourly RSI (Relative Strength Index) – The RSI for DOGE/USD is now below the 50 level.
Major Support Levels – $0.1705 and $0.1650.
Major Resistance Levels – $0.1800 and $0.1850.
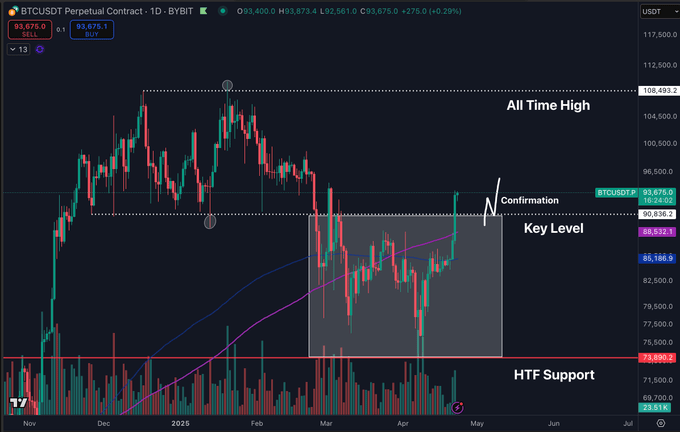
‘All Bets Off’ If Bitcoin Reclaims This Level, But Analysts Warn Of Potential Rejection
This week’s market recovery has seen Bitcoin (BTC) surge over 10% to retest a key barrier for the fi...
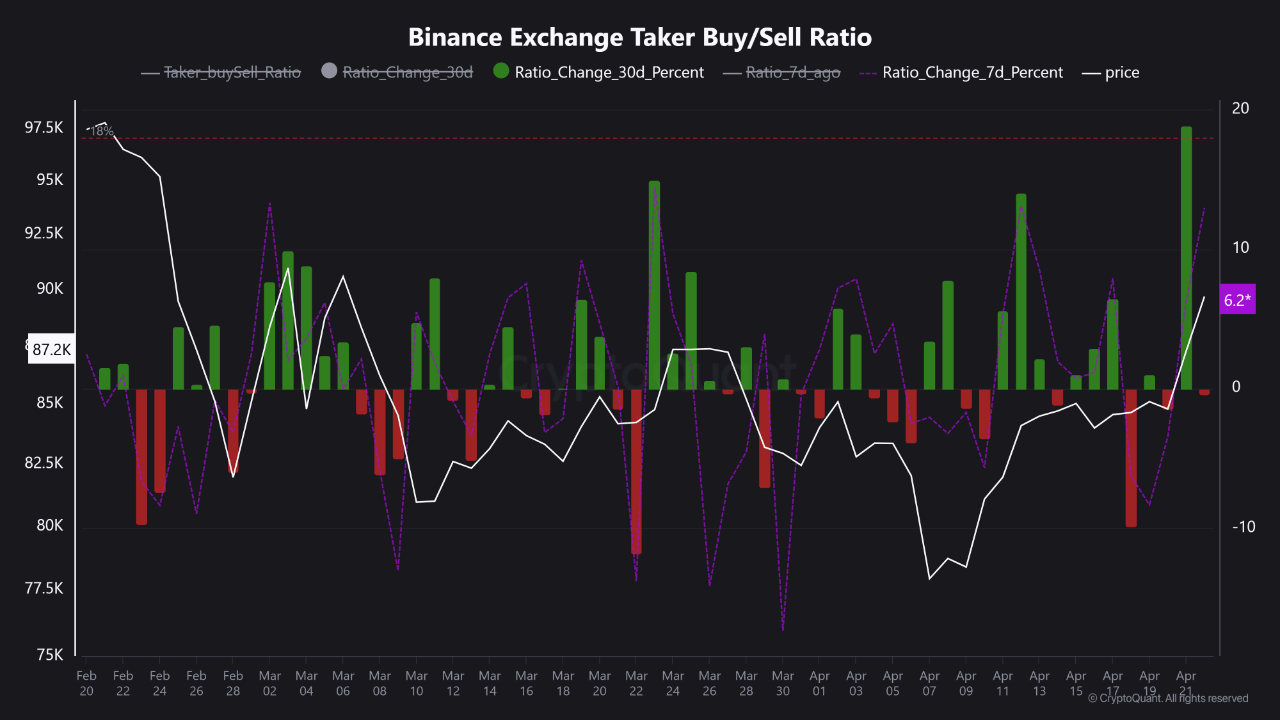
Bitcoin Buyers Take Control on Binance, But Funding Rates Flash a Warning
The Bitcoin market appears to have resumed its upward momentum, with BTC’s price trading above the p...
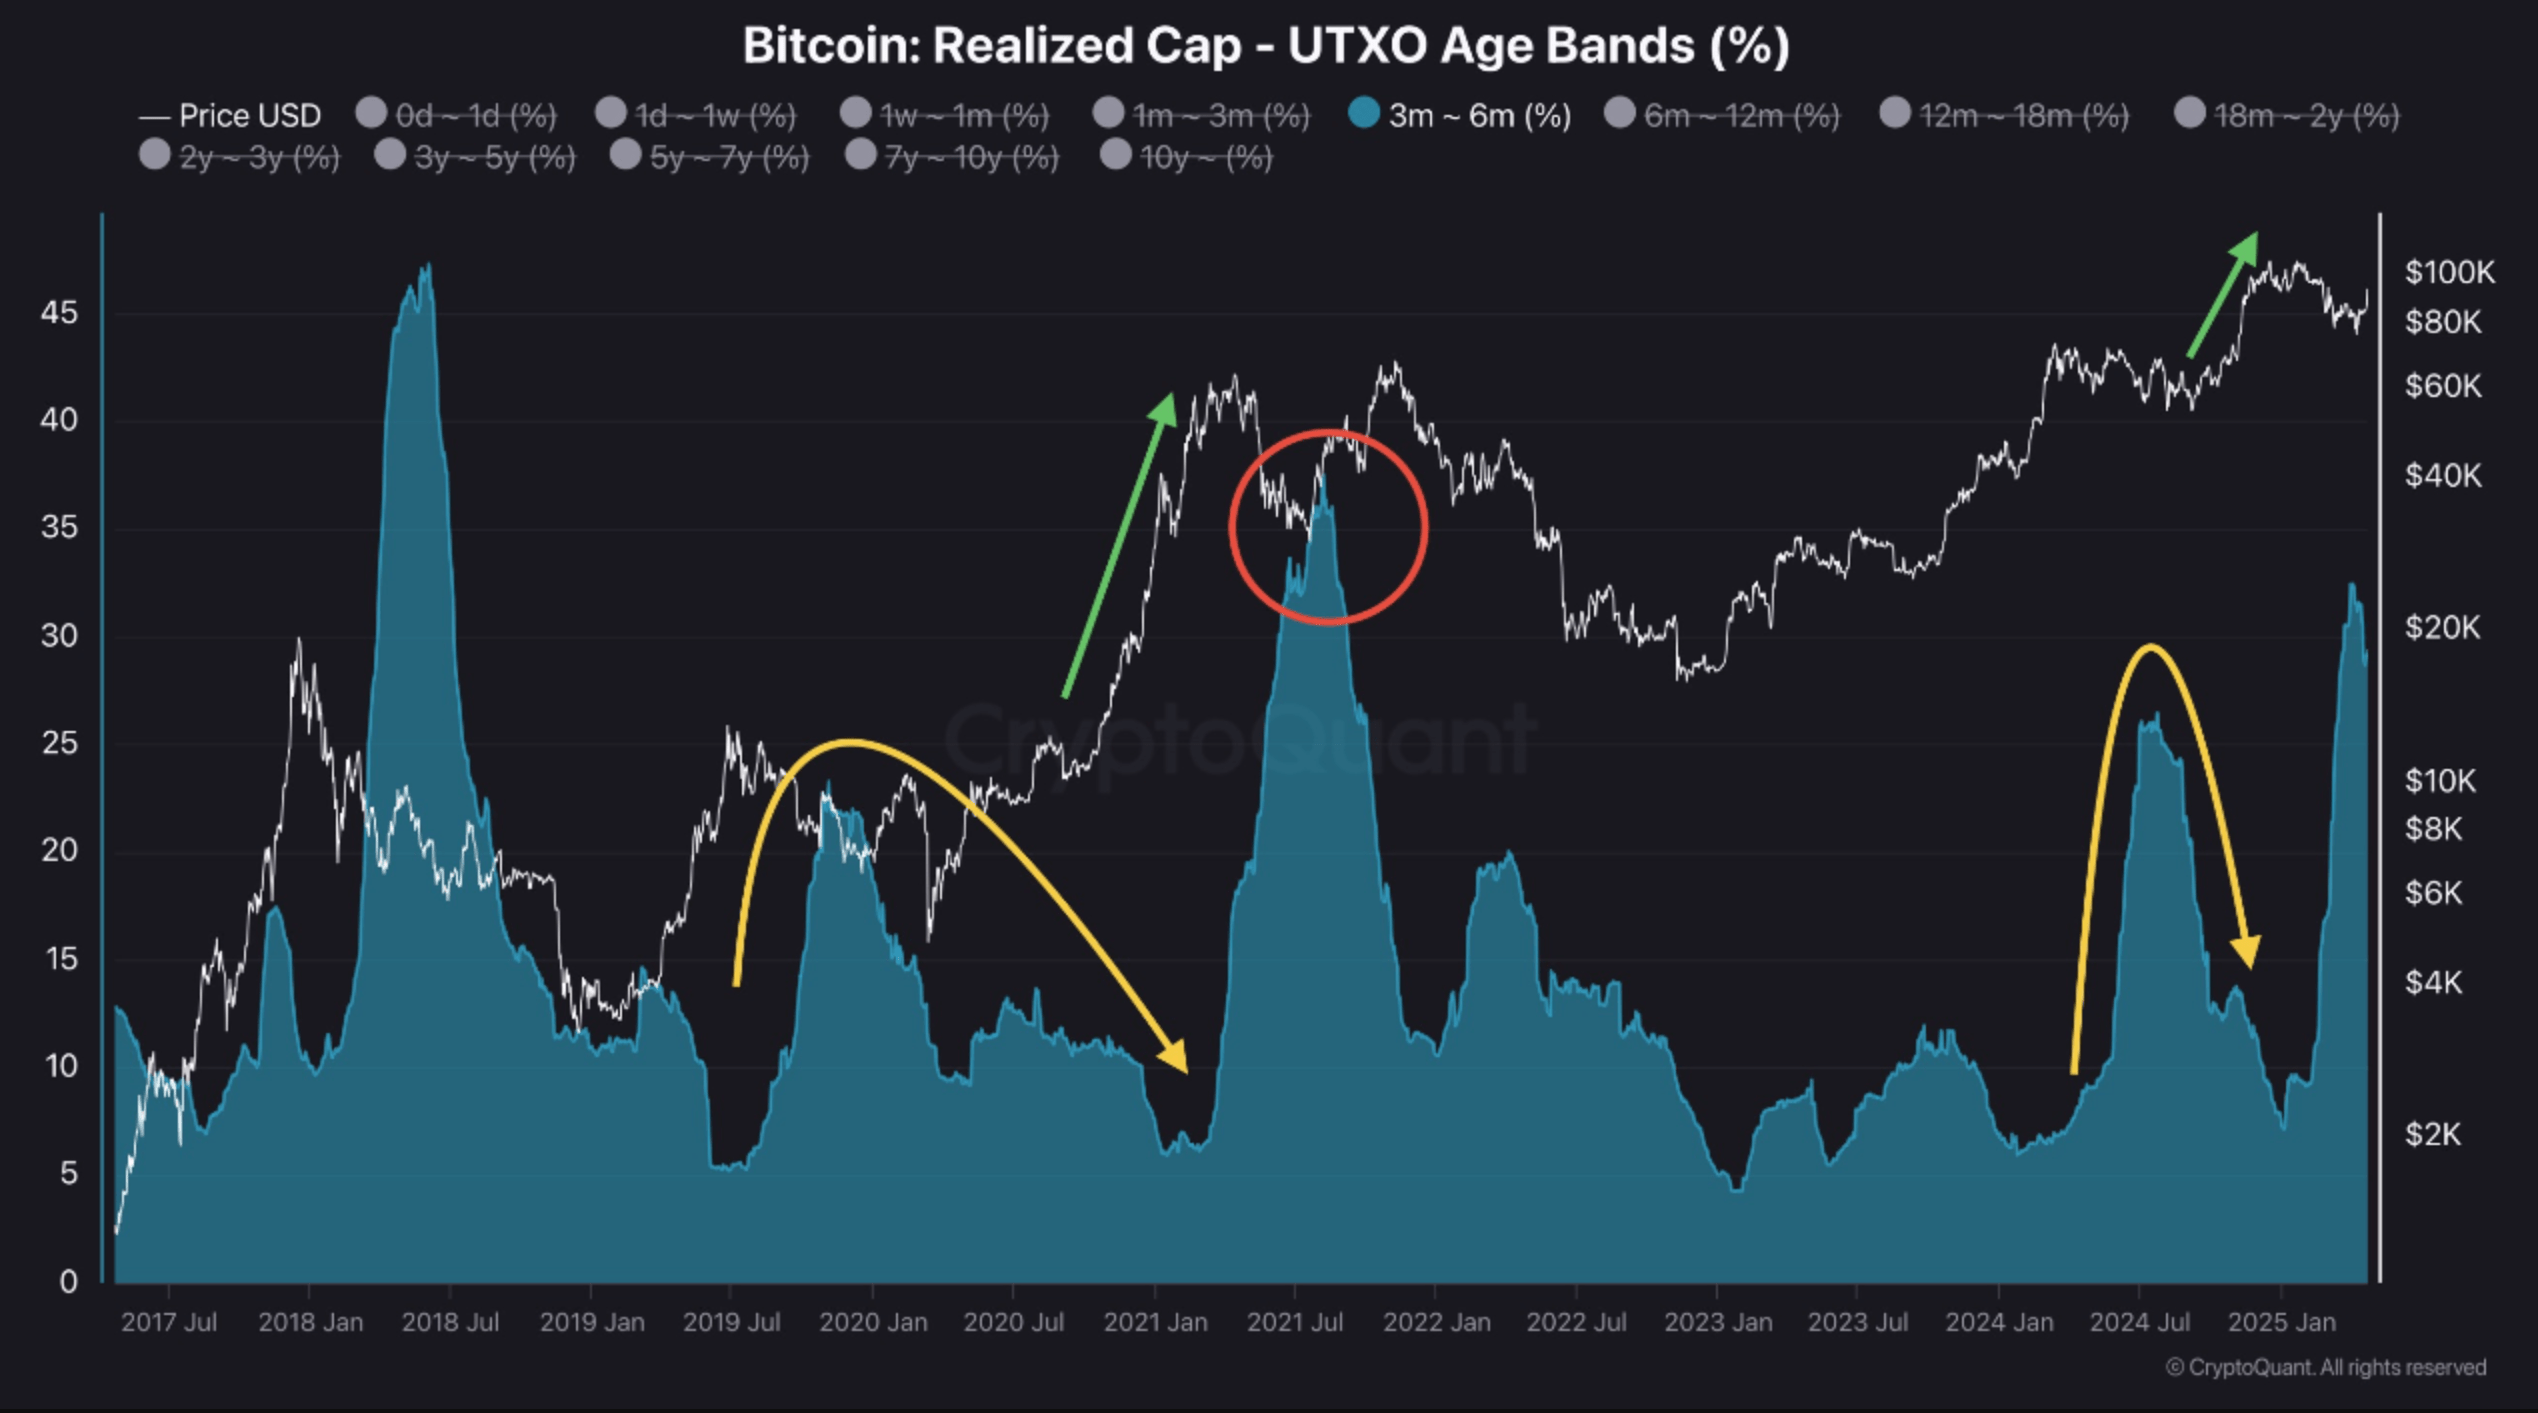
Bitcoin Surpasses Realized Price Of Recent Buyers — Rally Incoming Or Double Top?
Recent positive price action has propelled Bitcoin (BTC) above the short-term holders’ realized pric...